MATICUSD ❕ downtrendMATIC is moving in a downward channel.
Price has fallen below the 50, 100 and 200MAs on the 30m Timeframe.
100MA may break down 200MA on 30m Timeframe soon.
I expect MATIC to fix below the resistance level and then continue to fall.
MATICUSD trade ideas

Matic price runningI think BTC will break down from 30k to 20k which makes Matic running chart like on my idea

matic aint ready neitherIn order to complete same corrective pattern one more time, matic has to go lower
Hold my beer pls
----
No financial advice, do your own research, don't be stupid

MaticFull reversal imminent back down to it's impulsive move around $.50 but could go lower than that.
Not a bad project by any means - but it's run it's course.

MATIC/USDT - H&Supdate on my previous post.
3 scenarios..
- dump right here on weekly close
- We close and open under trend, spike to the upside shown in green arrow.
or
- We close weekly under trend, on open spike to the upside tap where shown then dump
either way, risk management is key and how you ladder into positions. Never use huge leverage right off the bat, as the market will take you out.
Safe trading all

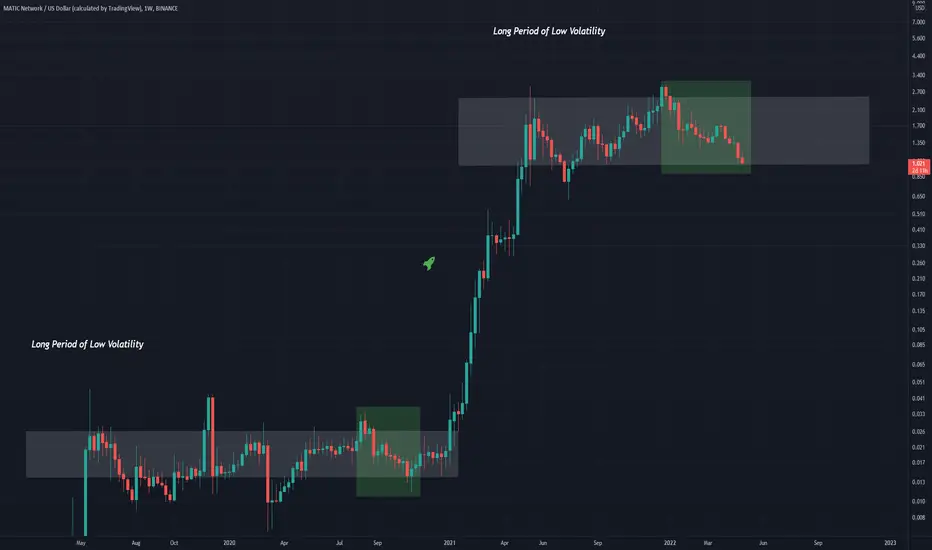
MATICUSD Long Period of Low VolatilityAn observation of the MATICUSD log chart which shows a prior long period of low volatility which led to extreme growth
Currently, price is going through a similar 'low volatility' phase, which will also ultimately lead to large gains
Similar price action documented in green
Polygon MaticMatic polygon, I don’t know too much about it. I think this has something to do with NFT markets also. Descent scalp in my opinion.

MATIC ANALYSISMATIC, the native tokens of Polygon, is an ERC-20 token running on the Ethereum blockchain. The tokens are used for payment services on Polygon and as a settlement currency between users who operate within the Polygon ecosystem. The transaction fees on Polygon sidechains are also paid in MATIC tokens.

Simple chart for Polygon - Support zone for MATICSimple chart for Polygon - Support zone for MATIC
After we lost the important support at $1.36 no price has to bounce between $1.00 - 1.15.
Otherwise we are back in Pennystock area since the volume support below is very low.
What are your thoughts on this Crypto?
Drop me a nice comment if you'd like me to analyze any other cryptocurrency.
*not financial advice
do your own research before investing

$MATIC heading back to 0.60$?if bitcoin keeps dropping again on the price and sentiment is bearish as it is for the moment , $Matic is simply following the other market trend and will continue to drop further , watch for these level to be broken and then retested , once level is broken it will get retested and if its rejected next level down is possible , same for upside too , be cautious on this hard times and be sure you DCA into market in lower prices so you can profit in next bullish phase.

MATICUSD BreakoutWill MATIC break out the current descending trend?
This is not financial advice. Tread carefully.

POLYGON BREAKOUTThe mainnet that makes eth scalable.
Need the RSI to make a higher high or this could be invalidated rather quickly.
DYOR.
Like and comment if you agree or disagree.

Bears and Bulls fighting it out over PolygonPolygon is a cryptocurrency, with the symbol MATIC, and also a technology platform that enables blockchain networks to connect and scale. Polygon—"Ethereum's internet of blockchains"— launched under the name Matic Network in 2017.


MATICUSD A benchmark for the next bullish break-outI haven't posted a public idea on the Matic Network (MATICUSD) in a long time. Even though we might be 1 or 2 months away from a new parabolic rally, this analysis may serve as a benchmark to spot when you may enter buys in the market with a confirmed break-out.
As you see the price action since the May 2021 High resembles the sequence from December 2019 to December 2020. In the later stages of that sequence, the price entered a narrow consolidation pattern which broke upwards when the 0.236 Fibonacci retracement level broke. The 1D Golden Cross (1D MA50 crossing above the 1D MA200) simply confirmed the break-out that initiated a massive parabolic rally.
Right now the 0.236 Fib is at 2.452.
--------------------------------------------------------------------------------------------------------
** Please support this idea with your likes and comments, it is the best way to keep it relevant and support me. **
--------------------------------------------------------------------------------------------------------

MATICUSD ❕ an upward channel is formedContinuing to move in the downward channel, the Matic formed an upward channel. During this, the price broke up through the 100MA on the 4H Timeframe and trading volumes increased while the price traded above the liquidity level. I expect a second decline to the support level, fixing above it and then reaching the resistance level.

MATIC : SCALPINGDaily MACD is crossing up
.
This is my trading diary, if u follow it
Please Set SL at ur acceptable risk

MATIC support held and approaching breakoutMATIC has found support at $1.30
Monitor for trend breakout and to clear MA50.
Targets are $.175 and $2.10
Good Luck

MATIC 15% gain entry incomingToday I'm doing something a little differently. I've decided to let the charts speak in detail instead of a lot of words. If I have something special to say about the specific instrument. I will mention it here. For general Crypto updates, please take a look at my BTC update.
One thing to keep in mind is that we are in a short-term downward wave today and we haven't reached the end of it.

MATICUSD ❕ descending channelAt the moment, the price, continuing to move in the descending channel, is retesting the support level. If the price fixes under this level, then I expect to reach the target indicated on the chart.

MATIC chances are looking pretty good for breakoutIt’s at a huge support as shown on the VPVR and from my experience using MATIC I see fundamental value here. Weekly rsi curling at local bottom looks nice too. Price targets are
$2.00
$2.50 by end of summer
$3.50 by end of year
If everything goes well and a bullish breakout and trend is created I don’t see why we all can’t make a nice profit here.

MATIC / USD MATICUSD Descending triangle is usually a bearish triangle.
But what am gonna do is just wait for a clear breakout either way with a full body candle of the triangle whether its up or down and ride it.

MATIC bottomed near 1.3 w/ engulfing; big resistance zone aheadThis just an update from the previous post w/c finally starts to play out.
MATIC most likely bottomed as it has repeatedly bounced from the 1.3 zone. However there is a big resistance zone between 1.533 & 1.67.
There should be a follow up to this engulfing candle in the days ahead. Failure to break above the resistance zone will set MATIC in a consolidation range.
Not trading advice
