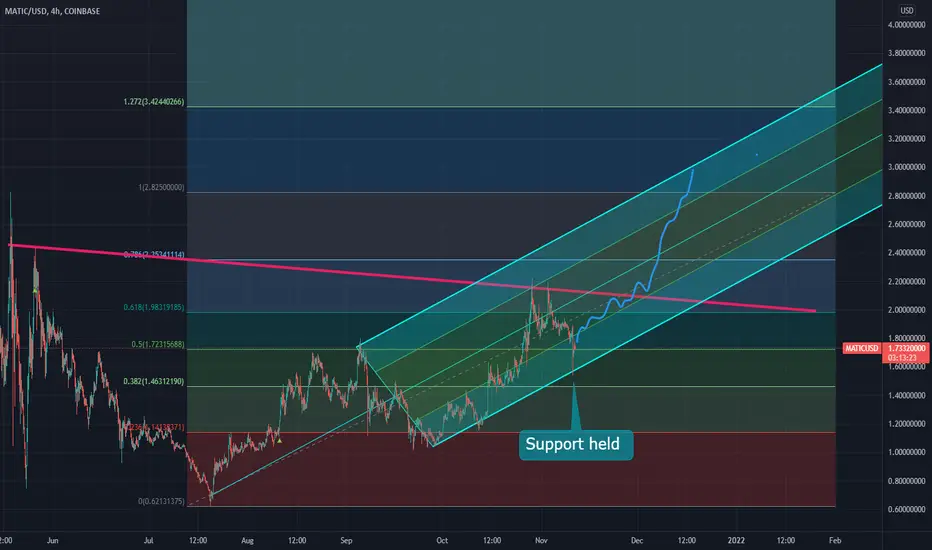
MATIC long battle for ATHI believe MATIC will have a steady up hill climb and squeeze against the RED descending trend line.
Once broken, that is where we could see the impulse to test ATH.
Good Luck
MATICUSD trade ideas
Downside SlopingThe Polygon (MATICUSD) is currently sloping downward and my take on this is to wait till 121 INR and if it crosses below that then look for 117 INR and again if it crosses below that then look for 114 INR because that these three levels are very much important on a daily time frame.
114 INR is turning point. If it crosses below 149 INR then it may go deep down.

MATIC update 1.50 entry confirmed now ready for 2.5 and $3.00Got my entry now look for it go stay above the vwap @1.75 it will be ready to go. Be cautious below it

MATIC - Bounce time!?MATIC is in a good position to bounce at 8h TF. As you can see we`ve also got TD4 on this interval, bounce on the flow is possible ..., of course it is necessary to monitor what is happening with the BTC, as it can pull the price behind it despite the good setup.
An excellent indicator is available to you here:

MATIC primed for upsideThere appears to be a hammer candle, and MATIC is currently using 1.75 support. It could fall to 1.50 range as the next level of support.
Confluences:
Market structure of Higher Highs and Lower Highs
Hammer candle indicating bullish move
Breaking through 1.75 then using it as support.
Risking 20% (to 1.42) for 60% (to 2.82).

MATIC upside incomingMATIC sitting between 0.50-0.618 level, reloading upside and may print another ATH if the bull cycle continues.

$MATIC TAFIB
TRENDLINES
KEY LEVEL 1.80
When $ETH Breaks out into price discovery in Novemeber, expect MATIC to follow strong.
Matic provides scaling for ETH network as a layer two. It is also being used for NFTs and Crypto Gaming

MATIC: Consolidated at PRZ, momentum squeeze, volume shiftMatic is exhibiting some strong signs of an imminent upside move.

MATIC retest of 1.60 possible thereafter $3.50 ATH comingMATIC had agood clean breakout now pausing at $2.00 mark. It could very well be testing 1.60 level in coming days before taking off to higher levels and possibly breaking all time highs again.

MaticEntry 1.95 or 2.05 which is abov upper reisatnce of thi masive triangle.
1.95 might be the first entry for a big push to 2.03
Break 2.03 this target is 2.44
If this turns into a large W patten the W neckline is 2.22
Lower support is 1.83$

MATIC on the short term rise?We seem to be experiencing higher highs and higher lows over the course of the last couple of days, and the support around the $1.87 - $1.88 has held fairly consistently. We may continue that upward trend in parallel channel, but will be break through the $1.96 - $1.98 resistance?

MATICUSD breakdown and support zoneA greater market move needs to pull MATICUSD with it, but right now I see room for a move downward to $1.83 or $1.63.

Polygon looking goodGreeting fellow crypto hounds. $MATIC Nice move up recently on good volume to settle in above a previous high. Appears to be consolidating and establishing a new POC around the 1.9 area as well as letting the 20ma catch up.
Looking for a continuation unless the general market hits some bumps. Likely to see some resistance in those previous high areas around 2.4 - 2.5 but I continue to be bullish on MATIC
I am holding MATIC in both medium and long term folios
Peace and Good luck

MATIC triangle patternMATIC presenting triangle pattern, be ready for price breakouts outside the charted limits.

Polygon (MATIC) - November 7Hello?
Welcome, traders.
By "following", you can always get new information quickly.
Please also click "Like".
Have a nice day.
-------------------------------------
(MATICUSD 1W Chart) - Mid-Long-Term Perspective
Above 0.681 point: Expected to create a new wave.
The wave cannot be considered complete and requires careful trading.
(1D chart)
In the CCI-RC indicator, the CCI line has risen above the +100 point, entering an uptrend.
We need to see if the CCI line can touch the EMA line and continue the uptrend.
If the price maintains above the 1.634-1.837 range, a move is expected to move higher than the 2.447 point.
The key point for this rise is the 1.443 point.
Therefore, if the price holds above the 1.443 point, we expect the uptrend to continue.
------------------------------------------
(MATICBTC 1W chart)
------------------------------------------
We recommend that you trade with your average unit price.
This is because, if the price is below your average unit price, whether it is in an uptrend or in a downtrend, there is a high possibility that you will not be able to get a big profit due to the psychological burden.
The center of all trading starts with the average unit price at which you start trading.
If you ignore this, you may be trading in the wrong direction.
Therefore, it is important to find a way to lower the average unit price and adjust the proportion of the investment, ultimately allowing the funds corresponding to the profits to regenerate themselves.
------------------------------------------------------------ -----------------------------------------------------
** All indicators are lagging indicators.
Therefore, it is important to be aware that the indicator moves accordingly with the movement of price and volume.
However, for the sake of convenience, we are talking in reverse for the interpretation of the indicator.
** The MRHAB-O and MRHAB-B indicators used in the chart are indicators of our channel that have not yet been released.
(Because it is not public, you can use this chart without any restrictions by sharing this chart and copying and pasting the indicators.)
** The wRSI_SR indicator is an indicator created by adding settings and options to the existing Stochastic RSI indicator.
Therefore, the interpretation is the same as the traditional Stochastic RSI indicator. (K, D line -> R, S line)
** The OBV indicator was re-created by applying a formula to the DepthHouse Trading indicator, an indicator disclosed by oh92. (Thanks for this.)
** Support or resistance is based on the closing price of the 1D chart.
** All descriptions are for reference only and do not guarantee a profit or loss in investment.
(Short-term Stop Loss can be said to be a point where profit and loss can be preserved or additional entry can be made through split trading. It is a short-term investment perspective.)

MATIC Will support hold?MACD is looking to visit lower levels, before RED trendline is challenged.
Use the pitch fork and fibs for support.
Good Luck
