Matic usdt. WHello friends, I hope you are well, we have matic currency chart in weekly time frame. As you can see, it is placed inside a triangle, if the bitcoin trend is upward, it can move in the path designed with blue color, otherwise, I imagine the red path. In the meantime, let me remind you that in the daily time frame, the chart has passed through the red Ichimoku cloud and is pulling back.
Please share your comments and support this idea with a like.
Thank you
MATICUSDT trade ideas

Matic usdt wHello friends, I hope you are well, we have matic currency chart in weekly time frame. As you can see, it is placed inside a triangle, if the bitcoin trend is upward, it can move in the path designed with blue color, otherwise, I imagine the red path. In the meantime, let me remind you that in the daily time frame, the chart has passed through the red Ichimoku cloud and is pulling back.
Please share your comments and support this idea with a like.
Thank you

Matic Long SetuoMatic is currently forming a CVD absorption divergence. If the low is held, the take profit (TP) is at the last high.
Have fun and good luck!"
Matic bildet gerade eine CVD Absorption Divergenz. Wenn der Low gehalten wird ist der TP beim Letzten High.
Viel Spaß und viel Glück

Matic Long Term SetupHello everyone (whoever follows or aware that I exist),
I believe Matic will claim 1.34 in a month. We can expect a small correction from around there and then the last impulse move will occur.
All targets specified.
Good luck to us all.

Polygon Peaks | Head & Should Pattern (Correction Explained)Polygon (MATICUSDT) is now preparing for a lower low.
Three peaks in succession is a common top signal and many people read it as Head & Shoulders, but truly as long as three peaks show up it can signal that a reversal is about to take place. It also works at support.
➖ The first peak happened in November.
➖ The second peak December 2023.
➖ The third and last peak happened February 2024.
The third peak is a lower high compared to Dec., coupled with decreasing volume.
The peak was hit yesterday so it is early for this move.
The down wave can take several months to fully develop.
Some pairs will retrace for a few days at maximum while others will do it for 1-3 weeks. The big ones and those that grew really strong can enter a corrective phase and move down for months. Bitcoin for example can move lower for 4-6 months... This is a possibility that I am starting to see.
On the other hand, we can have a flash crash and everything is over within three weeks... For this, we have to wait and see.
What we do know for certain is that the market tends to correct after a long period of growth.
2023 was the recovery year and 2024 the bull-market.
The correction will set the stage for the next major bull-market.
Namaste.

Matic Trendline Breakout Long Long!!Hello Traders i hope you are doing well
Matic Breakout from strong trendline and now next target will be 1$ and 1.6$

MATIC - Bullish Flash on THIS Indicator 📢📉Hi Traders, Investors and Speculators of Charts📈
If you've been following, you'll know I'm fundamentally bullish on MATIC. And it gets better than fundamentals - we just saw a bullish "BUY" signal flash on the weekly from a powerful indicator!
Polygon is unique in that it's a blockchain platform designed to work with another blockchain platform. It improves Ethereum's scalability - which we all know if the biggest problem of ETH. ETH dApps can use Polygon's sidechains, thereby making it a functional and fundamentally great choice as an altcoin asset.
One of the exciting things about Polygon is the partnerships it has established. Many big brands are working with Polygon to launch their NFT projects. Current partners include:
✅ Walt Disney
✅ Starbucks
✅ Meta Platforms
✅ Nike
✅ Mercedes
✅ Google
✅ Adidas
✅ Adobe
✅ Mastercard
✅ Reddit
While it might not pump as hard as other altcoins, it's also far less likely to fail than smaller , newer cryptos with similar aims - and it still has plenty of room to grow. Its partnerships make it an interesting buy for those who are interested in a well diversified portfolio, containing assets with real-world use case and strong fundamentals.
A possible scenario like this seems possible IF we can maintain closing daily candles ABOVE the diagonal trendline (support):
A drop and CLOSE UNDER this zone invalidates short term bullish sentiment:
If you found this content helpful, please remember to hit like and subscribe and never miss a moment in the markets.
_______________________
📢Follow us here on TradingView for daily updates📢
👍Hit like & Follow 👍
CryptoCheck
BINANCE:MATICUSDT

Analysis for MATIC/USDT Market Overview:
The MATIC/USDT cryptocurrency pair is currently under examination for potential trading opportunities. This analysis aims to provide insights for traders considering a selling position at a specified price of 1.000 USDT.
Technical Analysis:
Historical Trend:
The historical trend indicates a recent upward movement in the MATIC/USDT pair.
The price has approached the 1.000 USDT level, raising the possibility of a key resistance zone.
Technical Indicators:
Key technical indicators, such as the Relative Strength Index (RSI) and Moving Averages, need to be monitored for signals of potential overbought conditions or trend reversals.
Chart Patterns:
Identify any significant chart patterns, such as triangles or channels, that may influence the future price movement.
Fundamental Analysis:
Trading Position:
Position: Sell at 1.000 USDT.
Justification:
The selling position at 1.000 USDT is chosen based on the observed historical trend and the potential resistance level at this price. Traders should closely monitor technical indicators and fundamental factors for confirmation.
Risk Management:
Stop-Loss: Implement a stop-loss strategy to limit potential losses in case of adverse price movements.
Risk/Reward Ratio: Evaluate the risk/reward ratio to ensure a balanced and effective risk management approach.
Conclusion:
This analysis serves as a starting point for traders considering a selling position in MATIC/USDT. It is crucial to stay informed about market developments and adjust the strategy accordingly. Trading decisions should be based on a comprehensive understanding of both technical and fundamental factors.
Note: Always adapt the analysis to real-time market conditions and conduct thorough research before making trading decisions.

[MATIC] Time for the Bull ?After a long time almost side way or on a downside move, it's probably the moment for a new push soon.
The wall around $0.8 with it huge fake break-down lead to a push to the up. For me this can be the start of the move I am waiting since a while.
We need price to break the $1.0930 level with strenght to confirme this move, otherwise it will be better to close this entry and wait for a new entry point.
Great Trade !

MATIC Buy Trade Blueprint: Seizing the Moment for Maximum Gains ## Polygon (MATIC) Recent News and Disclaimer:
**Disclaimer:** I am not a financial advisor and this is not financial advice. Please do your own research before making any investment decisions.
**Recent News:**
* **February 17, 2024:** Polygon zkEVM mainnet beta launch announced, enabling faster and cheaper transactions on the Ethereum network.
* **February 15, 2024:** Polygon Studios announces $100 million Web3 gaming fund to support game developers building on Polygon.
* **February 14, 2024:** Decentralized exchange SushiSwap migrates to Polygon, bringing increased liquidity and trading volume.
* **February 9, 2024:** Polygon partners with Mastercard to enable seamless fiat-to-crypto payments for millions of users.
* **February 7, 2024:** Polygon integrates with Chainlink Price Feeds, providing secure and reliable price data for DeFi applications.
**Overall Sentiment:**
The recent news around Polygon has been positive, with several major partnerships and developments announced. This has led to increased investor interest and a rise in the price of MATIC. However, it is important to remember that the cryptocurrency market is volatile and past performance is not indicative of future results.
**Additional Notes:**
* Polygon is a Layer 2 scaling solution for the Ethereum network, aiming to address Ethereum's scalability issues.
* MATIC is the native token of the Polygon network, used for gas fees and network governance.
* The current price of MATIC is around $1.10 (as of February 19, 2024).
I hope this information is helpful. Please let me know if you have any other questions.

MATIC ON THE PRICE REGULATION CHANNEL As seen on the daily chart, the price is in some sort of regulation zone. I marked the resistance areas within the scope of an upward break.

Matic is forming a Harmonic Pattern.Polygon (Matic) is trying to form a harmonic pattern known as "three drives pattern" .
You can trade it by opening a long position first. Then set a %2 stop loss and short it.
For target points, check the chart please.

MATIC NEXT STEPhello guys.
easy 1.42$ next step.
we re in the resistance 0.99$
but the triangle is rising triangle.
lets wait two weeks, because seams one candle must be red first.

MATICUSDTMATICUSDT: we are in weekly triangle wave, the MACD indicator is supporting 99% that fourth wave is gonna be triangle. currently we are in W,X,Y corrective of main and last wave E.
we will see very strong bull market after the price get close to 0.6300 and 0.6200

Matic about to reverse? ↘️Polygon at major resistance and at the top of a parallel channel, forming a diamond top pattern.
In my opinion we can start to see the start of a reversal from here

**MATIC** daily chart looks good.CPM 0.92Matic weekly / Daily charts looks good. if you wanna accumulate Matic, now is the time
TPS will be represented by green lines on the chart.

$MATIC Looking Super Strong on the Weekly. This is gonna go to 1.4 minimum.
Busting out of down channel.
VWAP anchor PINCH about to blow up.
200 EMA bounce as support and trading above 25 ema
Volume is there.
All signs point to North Pole.

MATIC Polygon Price TargetIf you haven`t sold MATIC when Robinhood delisted it:
With the stock market reaching record highs, there is growing optimism that the positive momentum could spill over into the crypto market.
Historically, we've seen a correlation between bullish sentiments in traditional markets and increased interest and investment in cryptocurrencies.
As traditional investors seek diversification and alternative assets, the crypto market, with its potential for high returns, could benefit from this wave of enthusiasm.
This alignment with the prevailing positive trends in the stock market might act as a catalyst, fostering a bullish outlook for the crypto market in the coming days.
My Price Target for MATIC is the next resistance, $0.92.

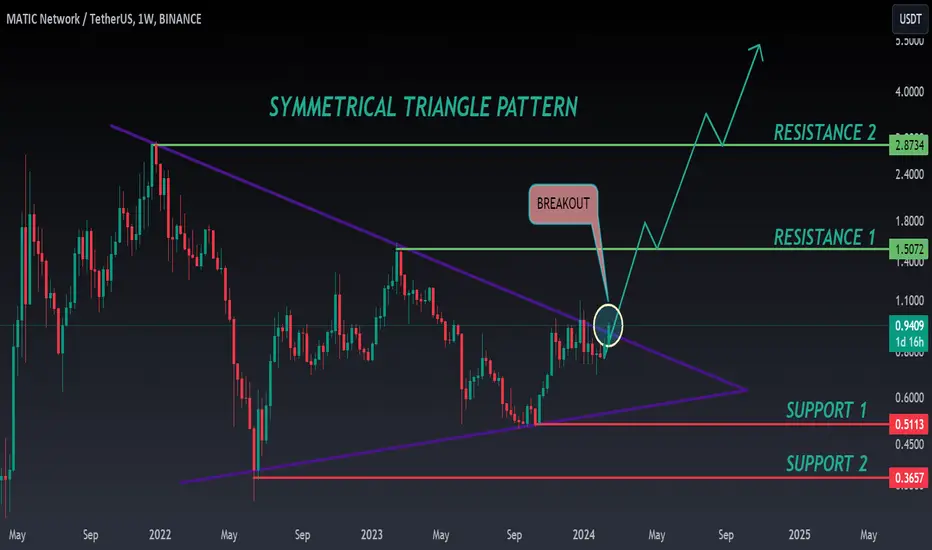
MATIC ANALYSIS🔮 #MATIC Analysis —— BREAKOUT 🚀🚀
💲💲 #MATIC was trading in a Symmetrical Triangle Pattern, gives a perfect breakout in weekly time frame as we expected, which indicates a bullish price movement for long term. 📈📈
💸Current Price -- $0.9410
📈Target Price -- $1.5072
⁉️ What to do?
- We have marked crucial levels in the chart . We can trade according to the chart and make some profits. 🚀💸
🏷Remember, the crypto market is dynamic in nature and changes rapidly, so always use stop loss and take proper knowledge before investments.
#MATIC #Cryptocurrency #Breakout #DYOR
MATICUSDT-A MASSIVE TRIANGLE THAT WILL LEAD TO AN EXPLOSIVE MOVEHello global traders and investors!
A brief overview of the MATICUSDT price chart reveals over 750 days of sideways movement since the peak in December 2021, forming an Elliott Wave Triangle(contracting) Pattern.
The Elliott Wave Triangle, a corrective pattern, features converging trendlines forming a contracting shape. Comprising five labeled waves (A, B, C, D, and E), each wave is subdivided into three smaller waves. Triangles usually appear in the fourth wave of an impulse or wave B of an ABC zigzag.
Future Price Action
A breach above the (d) triangle extreme at 1.0930 indicates the pattern's conclusion. The post-triangle thrust measurement suggests a potential price movement to $6.5 in the upcoming weeks.
As always if you find this analysis helpful, please don't forget to leave a like, comment and hit the follow button. Till next time, trade safe and may the market favor you

Matic dangerous redistribution ZONES in longterm view!Stop fixing on shortterm charts and somtimes Check the longterm trend in logarithmic view. After doing imaginary returns, matic for past 2 years is in distribution, and creates smart money distribution zones.
Don’t fall into the trap and don’t pay for the gains of people who bought in 2019-2020!
Don’t be naive

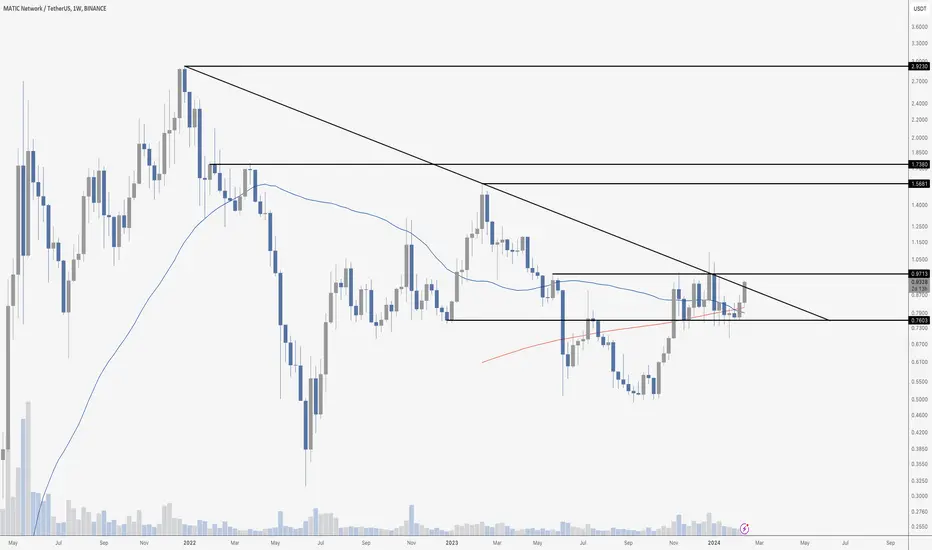
MATIC BREAKING OUT?Matic remains one of my largest positions, which I have traded around for the past few years. It may be time to add to the holdings once again. This is a WEEKLY chart, so we want to see a close above the descending resistance. A few weeks ago we saw two wicks through this line, which we want to avoid here.
As you can see, price has also cleared both the 50 MA and 200 MA resistances as well.
With a close above resistance, I am looking for a slow move to around $1.56.
A “safer” entry would be above the 97 cent resistance.
#Matic breakout1. Supertrend positiv
2. positiv accumulation
3. positiv squeeze
Targets marked with dotted lines in chart
