Matic/usdt in weekly tmfpolygon (matic) with good news in weekly time frame shows bullish ... look at blue arrow that shows full body bullish candle , ingoulfed previous red candle ... i thing after break trend line and pullback to previous high it can run above 1.5 and higher...
its not a signal for buy or sell orders please search yourself to have the best.
wish you all good. chakker you Mamal
MATICUSDT trade ideas

🔥GLOBAL OVERVIEW On MATIC For The Bull Market❗️MATIC is of the strongest altcoins among thousands of crypto. The previos bull market confirms it. The growth by 110 times after the triangle breakout!
💥 It capitalization have already reached $300M and it has potential but it's around 30-50x ($27-40 per coin).
Locally, Matic can grow to the top of the channel by +110% and make a pullback. I expect the growth after this pullback, but the growth continue if it break the triangle streight now.
like❤️ and follow
Check the links and get a BONUS🎁 from me👇

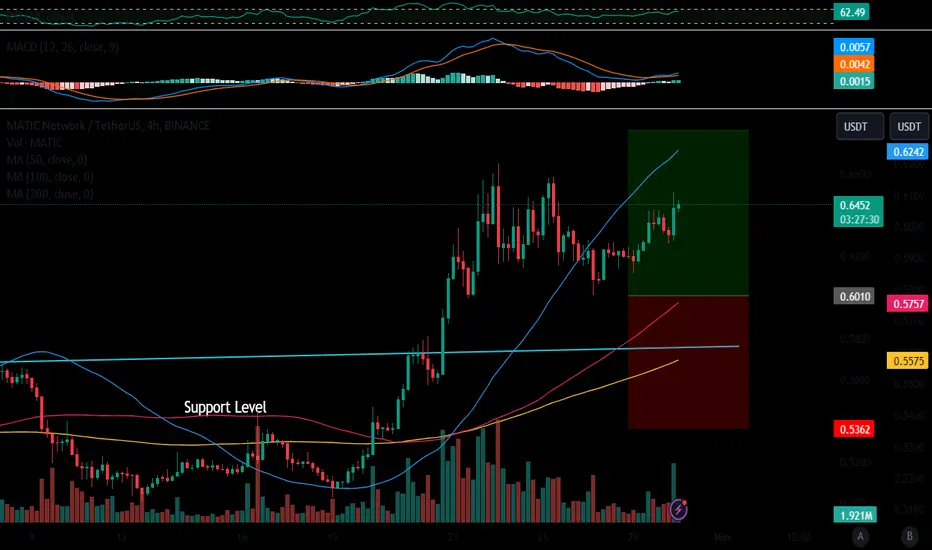
MATIC dips into demand on ascending triangle THe 4 hour time frame is my favorite for swing trading. MATIC is a long-term position for me I have it staked on Ethereum but I keep some on polygon to swing trade into alts like PYR and some others. That long wicked red candle appears to be the 4 hour demand zone and its good to see the token bounce on both the trend and demand. RSI is holding up if it loses steam we will likely fall right through demand or consolidate.

#MATIC/USDT is trying to break the PWH $0.666 resistance level #MATIC/USDT is trying to break the PWH $0.666 resistance level in 4-Hour TF!
Wait for Breakout/retest to open a long position. Wait for PDL $0.626 support and diagonal trend line breakdown to short $MATIC.

MATIC/USDT Technical Analysis: Deciphering the Chart SetupMATIC/USDT Technical Analysis: Deciphering the Chart Setup
Bullish Bounce from Symmetrical Triangle
MATIC currently trades around $0.65 after bouncing from the $0.52 level, which aligns with support of a symmetrical triangle on the daily chart.
Symmetrical triangles typically act as continuation patterns, so this bounce suggests a resumption of MATIC's uptrend within the triangle formation.
Favorable Higher Timeframe Structures
On the weekly chart, the symmetrical triangle takes shape as a larger bull pennant, which is also a bullish continuation pattern.
The confluence of constructive structures on the daily and weekly timeframes paints a positive picture for MATIC over the near term.
Measured Move Targets $1 Initially
The symmetrical triangle points to an initial measured move target of around $1 if MATIC can break out above the upper triangle trendline.
Reclaiming the key $1 level would likely propel additional upside momentum.
Potential for $5+ in a Bull Market
Looking longer-term, if MATIC breaks and holds above $1 decisively on the weekly chart, the bullish structures an extended move towards $5 first, with the potential for $10 in a sustained crypto bull market.
Monitoring Key Support at $0.50
If macro conditions worsen, keeping an eye on the $0.50 support level is prudent. A breakdown below $0.50 would invalidate the bullishness and introduce downside risk towards $0.20.

MATIC/USDT 1DInterval ReviewI invite you to review the MATIC chart in pair with USDT. First, we will use the blue lines to mark the upward trend channel from which the price broke out, creating a downward trend channel in which we could currently see the price leaving it with a sideways movement.
When we unfold the Fib Retracement grid, we can see that the price remained at the upper limit, a very strong fundamental support zone from $0.58 to $0.31.
Looking the other way, we can see a significant resistance zone from $0.74 to $0.90, only after we break out of it and then test it positively will we be able to see a further upward movement towards the second zone from $1.15 to $1, $33.
Please look at the CHOP index, which indicates that most of the energy has been used, while the RSI and STOCH indicators show that we are moving at the upper limit, which may negatively affect the price and provide a rebound in the coming days.

Polygon Price Prediction Polygon Price Prediction By Coinilabot assistance– October 30
A couple of days ago, it was demonstrated that the efforts of bulls outpaced the effects of bears in market operations that involved Polygon and the US Dollar. As the financial record has it, the crypto-economic trade has hiked, converging below the value line of $0.65.
Given that the price has touched the upper Bollinger Band trend line, investors may remove a sizable portion of their profits from their holdings as it is anticipated that a required correction will soon take place. In the interim, in the event that the anticipated downward trend eventually materializes, the fundamental underlying support has been established around the $0.50 line. Investors with long-term horizons should hold onto their positions ahead of the impending bullish cycle.
MATIC/USD Market
Key Levels:
Resistance levels: $0.70, $0.75, $0.80
Support levels: $0.55, $0.50, $0.45
MATIC/USD – Daily Chart
The MATIC/USD daily chart reveals the crypto trade has hiked, converging below the line of $0.65.
The outlook of the indicators suggests that further forces in the moon direction have been gradually reducing, formulating a warning signal against getting free uprisings from its current trading spot. The Bollinger Band trend lines are seen around $0.675, $0.569, and the lower part at $0.464. The stochastic oscillators are slightly pointing southbound from 73.222 to 63.226.
As of the present trading price of $0.627, what is the financial status of traders in the MATIC/USD market?
Traders in the MATIC/USD market operations are to exercise some level of cautiousness, especially those acting on the basis of either short- or medium-term, as the crypto market has hiked, converging below the line of $0.65 at a close spot.
From the technical point of view, long-position pushers have to allow a condition that will showcase the placements on the stochastic oscillators at lower range values, possibly down into the oversold region, to be able to come across decent longing position orders. Nevertheless, investors are to hold their faith in the long-term running environment before cashing out at higher lines.
Bears may typically exert all of their energy into stalling most moves that want to push higher over the $0.65–$0.70 mark, even when a volatile motion is likely to occur soon. To obtain a respectable entry order, it will be preferable to swap values or locations above them.
MATIC/BTC Price Analysis
In comparison, Polygon is still pricing at reduced values against the trending ability of Bitcoin, as the price is converging below the trend line of the middle Bollinger Band.
Due to their placement in range-bound zones between two layers, the Bollinger Band trend lines are oriented downward. The stochastic oscillators are situated just below the 50-value line. The current trade candlesticks’ view indicates that the base cryptocurrency is attempting to reclaim its positions against the counter-trading cryptocurrency.

$MATIC Mirroring BTC'S MovementThe altcoin market is mirroring BTC's performance quite closely. Most assets, MATIC included, are on an aggressive upward trajectory, following Bitcoin's lead. However, altcoins seem to have more room to grow, given that only a handful have touched their yearly highs.
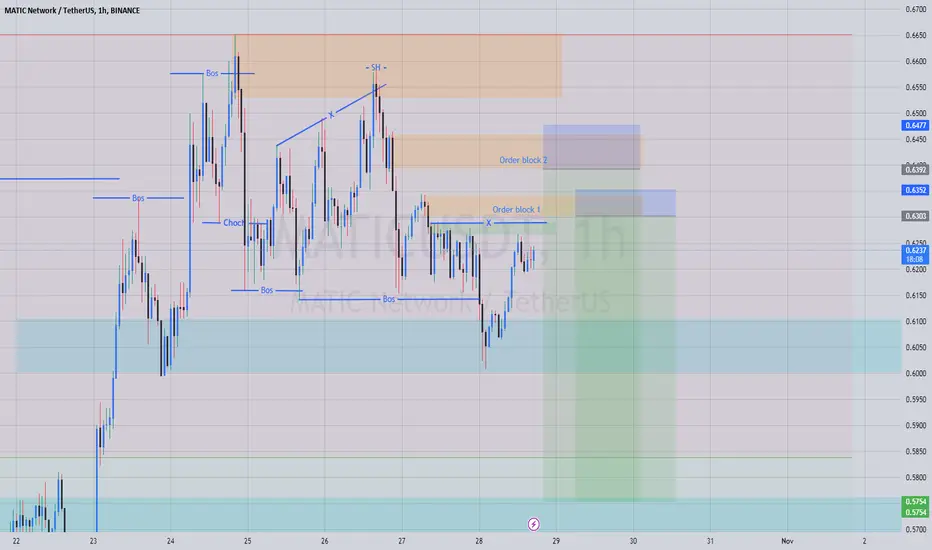
Presently, the MATIC trajectory is bullish. Its price is wedged between a support level at $0.63 and a resistance zone spanning from $0.648 to $0.657. Assuming this momentum continues, investors should keep an eye on the $0.67 and $0.70 milestones.
Although the MATIC movement is somewhat more subdued compared to BTC, short-term corrections are expected. Buying orders are mainly clustered around the $0.616-$0.625 zone, with significant levels at $0.612 and the range of $0.600-$0.606.
During such market fluctuations, prudence is paramount.
MATIC May Be Gearing Up for a Move to a New ATHA symmetrical triangle has emerged on the weekly MATIC/USDT chart, signaling the potential for an imminent breakout. Should this breakout be to the upside, MATIC's price may embark on a medium-term bullish trajectory, possibly propelling it to achieve a new all-time high (ATH). However, it's important to note that this optimistic scenario could be negated if MATIC falls below the $0.5540 threshold within the next two weeks. On the flip side, a weekly candle closure above $0.8220 could serve as an early confirmation of the impending bullish breakout.


Matic still meanderingMATIC is still floating around the horizontal channel but forming a massive wedge that needs to be broken. If the token can bounce of this 50 SMA it should break the wedge early to the upside, if not there are more weeks ahead to do so. I have been adding small bags on this token since last may and we successfully exited it last bull market for a nice profit.

Matic h1It reached the end of its downward channel and maintained a valid poi and will pump with eth because of the corolation

MATICUSDTIs MATICUSDT exhausting at highs?
As the price is been on high bull run but now it seems like price is lacking bullish momentum after printing double top pattern at resistance level and bearish divergence suggesting the sell pressure is about to start.
If the bears took control , the 1st target could be 0.5580
What you guys think of it?

maticA rather short picture emerges in this asset, let’s look at it. First, let's look at the local downward trend (it also acts as resistance), which formed after the upward trend was broken down. We tested it a couple of times, but we never saw any penetration.

Matic Moon Looking for some pump , bitcoin is about to breakout from resistance , here is my out look on this

Don't say I didn't warn youFive downward waves, wave A, were made, and three corrective waves were made, followed by wave B, and we expect a final five-wave downward wave C Let's see together what will happen

MaticUsdtmatic for this bullrun is good nd safe currency on market
Remember nothing is 100% safe.
But larger projects are safer but may give you a metric profit in exchange for less risk
matic is one of these
These goals are ahead for Bullrun
Good luck
EntryPoint:
0.6100
0.5847
0.5621
0.5431
Supports:
0.5140
0.4791
0.4617
0.4380
Resistances:
0.6520
Targets:
0.6963
0.7654
0.8625
1.0048
1.0878
1.2195
MidTime:
1.5119
1.7598
2.1376
HODL:
2.6479
3.0847
3.7437
GL

MATIC - increase of 50% possibleMATIC is on it’s way to break above the 200 day moving average (purple line on the picture). If the price flips $0,665 there is a possibility that the price can increase up to 50%.

Now 70% for MaticHello
Matic is struggling with trendline after breakout take long position.
Great divergence in RSI.

MATICUSDTrequested analysis
Preferably suitable for scalping and accurate as long as you watch carefully the price action with the drawn areas.
With your likes and comments, you give me enough energy to provide the best analysis on an ongoing basis.
And if you needed any analysis that was not on the page, you can ask me with a comment or a personal message..
Enjoy Trading... ;)

MATIC LONGMATIC LONG
ENTRY 0.6574 (only after 4H candle close above 0.6574)
Invalid if 4H candle close below 0.6369
SL 0.6094
TP1 0.7025 (close 100%)
LEV 10X OR 20X

🔥 MATIC Break Out From 8 Month Bear TrendAfter an initial strong start of 2023, MATIC has generally been selling off all year. Helped by Bitcoin's strength, MATIC has managed to break through the main bearish resistance that was holding back this token.
In my eyes, this can be the start of a new bullish trend for altcoins. Looking at 1.5$ target over the next few months.
