Matic, ready to take off?MATICUSDT / 1W
Hello Traders, welcome back to another market breakdown.
MAYICUSDT is one of the charts I'm waiting for confirmation then pul-back. The price seems to be forming a lower high major trend reversal pattern.
Checkout the chart for where I would like to get a spot entry.
Trade safely,
Trader Leo.
MATICUST trade ideas

MATICUSDT # 001 ( Supper cycle Crazy move is close to happen $ )Hello dear traders.
Good days .
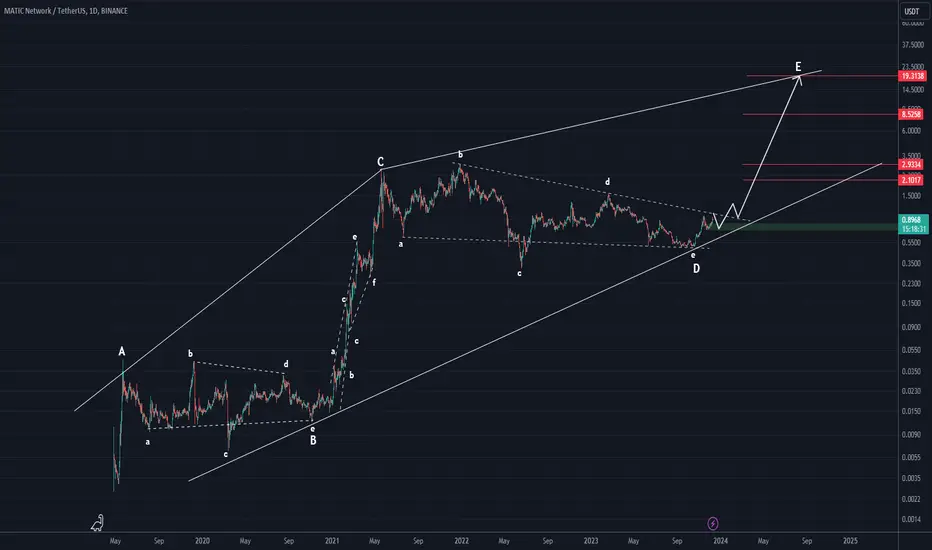
On daily MATICUSDT hit the 0.618 Gann Box fib level and with Final leg of Elliot it will try to reach itself to the 0.75 ( 1.077 $ ) or even 1.0 ( 1.27 $ ) Gann Box Fib price .
With following correction to pass this square it will pass important Monthly Gann Arc resistance which is in the Reversal time Zone .
After finish this Gann Square, 3rd Cycle of Elliot will start .
Long shut overview will updated .
Chart updated and route plotted with help of Gann Square and Gann Box.
Good luck and safe trades.
Thanks for your support and comments

maticToday it will be a 3rd candle in a row, completes a 26% upswing
Bullish scenario
Resistance in 1.17
Next resistance at 1.22
Bearish scenario
Support for 1.02
Support next 0.833 on 50 ema.

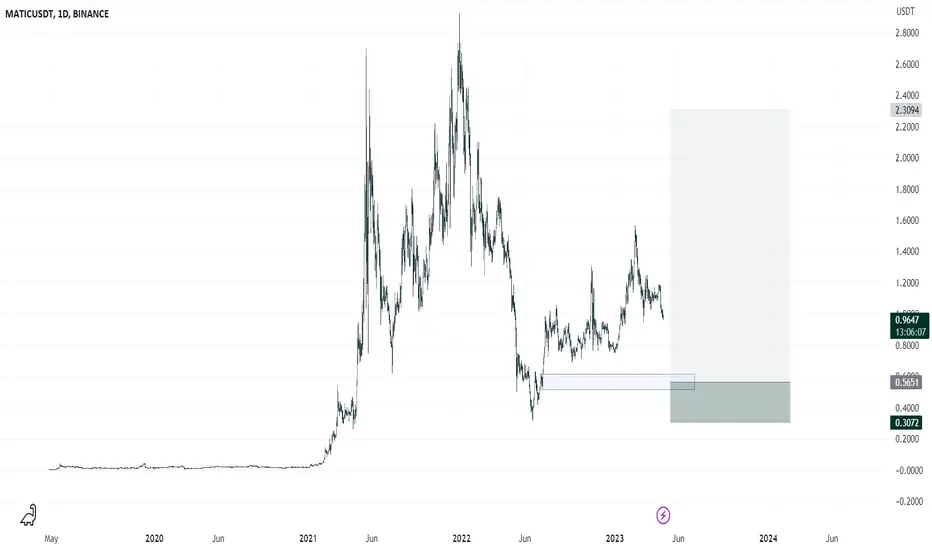
MATIC/USDT Bullish Potential in Demand Zone?👀🚀MATIC Analysis💎Paradisers, let's delve into #MATICUSDT as its showcasing a compelling pattern in the market. Positioned in a demand zone, it is hinting at a possible bullish movement.
💎 Recently, #MATIC faced resistance at the $0.8796 level and is now regaining momentum within the demand zone. This sets the stage for another attempt to breach the supply level where it was previously rejected. A successful break above this level could significantly increase the likelihood of reaching the major supply level at $0.9461.
💎 However, savvy traders always have a Plan B. In this scenario, if #Polygon fails to sustain its upward momentum, we might see a bullish recovery from the bullish Order Block (OB). But caution is key: if #MATIC falls below this OB level, it could signal the start of a downward trend. 🌴💰

Polygon - MATIC/USDT🚀 CRYPTOCAP:MATIC surges +48% after successful retest of macro market structure top. A breakout from the main pattern signals a new macro uptrend.
Monthly Close above $1.07 resistance could pave the way for further rally. 📈🔥
#MATIC #CryptoNews #BullishTrend

MATIC ROADMAP (1D TF)We seem to be in a large diametric whose wave D is coming to an end. This wave D looks like a triangle. Upon further investigation, we can see that we are now in wave e of d.
This scenario is confirmed by breaking the upper side of the triangle.
Note: This is a long-term vision and we will have many fluctuations along the way.
MATIC WEEKLY CHART MID TERM TARGET 200%MATIC WEEKLY CHART:
You can clearly see the past history breakout. It wouldn't be the same but you can expect 200% gain in mid term. I'm loading my bag with 1% of my Portfolio.


MATIC(Polygon) - Break Through the Long-Term Downward Trend Line
* 1W
It has finally broken through the long-term downward trend that has been going down since December 21, 2021.
* 1D
The retest was completed after breaking the long-term downward trend.
As the two-year decline has been broken, there can be a big rise.

MATICUSDTMATICUSDT spot buy at the order block which swept liquidity and has an imbalance before it..
MATICUSDT Elliott Waves AnalysisHello friends.
Please support my work by clicking the LIKE button👍(If you liked). Also i will appreciate for ur activity. Thank you!
Everything on the chart.
Entry: Market and lower
Targets: 0.97 and 1.05
after first target reached move ur stop to breakeven
Stop: ~0.68 (depending of ur risk). ALWAYS follow ur RM .
RR: 1 to 2
risk is justified
Good luck everyone!
Follow me on TRADINGView, if you don't want to miss my next analysis or signals.
It's not financial advice.
Dont Forget, always make your own research before to trade my ideas!
Open to any questions and suggestions

Matic - Falling wedge as part of a bigger patternBut for the short term I'm looking for it to pop 10-15c
Which is a healthy 20% move
The bigger breakout is getting past the 98 cents level
Which could see a quick move to a $1.25

MATIC - Inverted H&S 4Hr Chart A big inverted H&S has formed on the 4Hr chart of MATIC
A W pattern within this larger pattern can be seen to be forming allowing another move upwards
Completing the overall larger inverted H&S pattern and leading to bull continuation.

Update MATICUSDTNew data has appeared from retesting the bottom and the appearance of a high volume in the rise. It is possible to retest its last peak again.. All data has been placed on the chart.

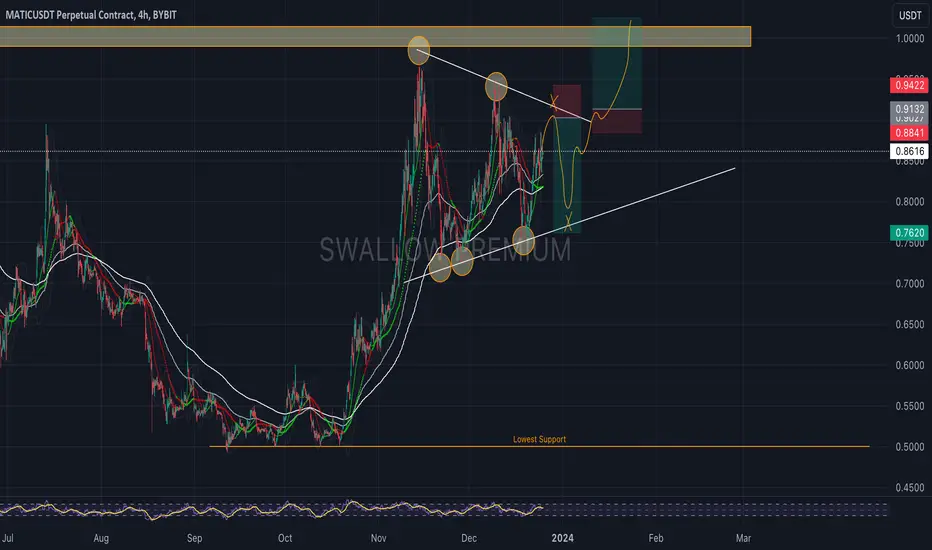
Polygon(MATIC): Multiple Potential Trades To Be Taken!Matic Coin has shown us some major moves here recently.
With many new opportunities opening up for us in smaller timeframes, we are looking for some kind of movement where we want to catch a nice short position and then a potential long one as well while remaining inside the zones here!
Swallow Team
#Matic The possibility of Elliott triangle formation and the patAfter an upward rally, the matic currency has formed a triangle pattern. If it can break the 78 cents range in the Fibo range of 61.8, it can navigate the specified possible movement to the area of 1.02 to 1.07.

MATIC Inverse head and shoulder BOMATIC inverse head n shoulder spotted.
just breakout above $0.90.
as long as price above 0.90 should be fine.
next resistance at 1.30-1.40

MATIC Long for Massive ReturnsMatic breaking out cleanly on the weekly. I'm looking at TP's for a swing trade around 1.2665, and 1.4621, which correlate with the 1.618 and the 3.618 on the Daily.
Get long and strong, paying close attention to Bitcoin for a potential breakdown of key levels. If not and BTC ranges, MATIC should continue and most likely create a new ATH in 2024 sooner than later.
Trade Well

MATICUSD Bullish short term outlook MATIC broke out of decening trendline and sucesfully retested the support level at 0.733
Expecting a move to 0.95 and potentially the start of a nice bullish rally to the 1.22.

[20-12-2023] $MATIC READY FOR PUMP - OVERSOLD ZONERSI showing we are in deviation range, me expect CRYPTOCAP:MATIC will pumping to $1 soon.
Now in accumulation mode, bid arround $.74-$.8 and still buying more if dump below.

MATICUSDT long T=1.50
A flag pattern, in technical analysis, is a price chart characterized by a sharp countertrend (the flag) succeeding a short-lived trend (the flag pole).
A bullish flag appears like an upright flag on a price chart, with a rectangular price pattern marking the flag itself.
The tighter the flag, the better the signal is said to be.

📊#MATIC cup-handle structure established, huge upside potential🧠As analyzed in my last post, we successfully broke through the short defense point and previous high above. This means that the cup-and-handle structure is established, and it also means that the upside space above is completely opened. So expect us to go even higher. 🙏🚀🌕
⚠️Note that although we are actively bullish, it does not mean that you should enter immediately, because the current stop loss range is too large, and the profit and loss ratio is not ideal, so be patient and wait for the entry opportunity after the correction. ☕️
Let’s see 👀
🔥Congratulations to all the friends who followed us to print money🎉💰🍻
🍻I have helped everyone make money, so I hope you can also help me. Please remember to like❤️share my analysis posts and channels. 📤

GET READY FOR MATIC!We'll talk about MATICUSDT in the next couple of weeks!
A nice bull run is possible in the mid-term
