I'll help you catch the "MATIC" long positionHello, nice to meet you, Friends!
I shared my perspective on Bitcoin today, and it rise correctly.
I'll give you my perspective again this time.
MATIC breaks throught the top of FALLING WEDGE.
It also rose sharply in RSI with the bullish divergence.
I think the moving average is going to be a positive arrangement, which means it's going to go up!
GOOL LUCK!!
MATICUST trade ideas

MATIC downside- matic heading to liquidity pool
- waiting for htf keylevel to hit
- looking for longs at keylevel
waiting for the prince MATIC to arrive,that's where the work Matic has so many significant support levels on the daily chart that one cannot ignore them. The areas I have identified are crucial Fibonacci points. On the daily chart, one must wait for Matic's prince to react in those areas.

182% with leverage x2 on MATICEntry from current levels, I also take leverage x2 for myself.
TP - $1.29
SL - $0.5
Achieving goals in 2 to 6 weeks.
This is not financial advice. Whatever you do, you do at your own risk!

MATIC: Falling Wedge and Triple Bottom Patterns"MATIC: Exciting trends with the 'falling wedge' and 'triple bottom' patterns forming. 📉🔍

MATIC - Clean and Clear ❗️Hello TradingView Family / Fellow Traders,
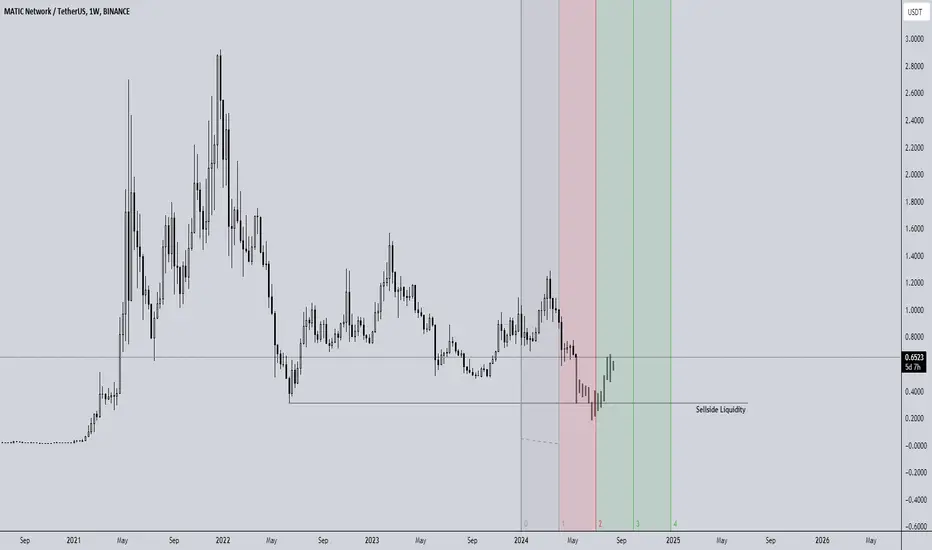
On Weekly: Left Chart
MATIC has been hovering within a big range in the shape of a flat rising channel marked in blue.
Currently, MATIC is approaching the lower bound of the range, so we will be looking for buy setups on lower timeframes.
On Daily: Right Chart
📈 For the bulls to take over, we need a momentum candle close below above the last major high highlighted in gray.
📉 Meanwhile, MATIC would be bearish short-term and can still trade lower inside the weekly support.
📚 Always follow your trading plan regarding entry, risk management, and trade management.
Good luck!
All Strategies Are Good; If Managed Properly!
~Richard Nasr

Polygone does a binanceMaybe some social medias use it IDK. just an idea if elons starts doing doge and Zuck starts doing Poly?

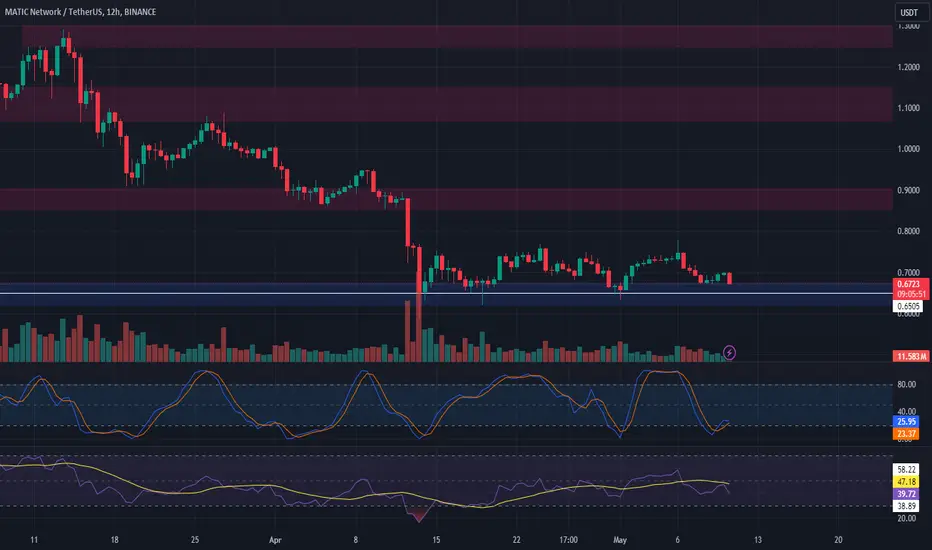
MATIC/USDT 4H Chart ReviewHello everyone, let's look at the 4H MATIC to USDT chart as we can see that the price is staying on a lopsided uptrend line.
Let's start by setting goals for the near future that we can include:
T1 = $0.73
T2 = $0.76
T3 = $0.79
AND
T4 = $0.82
Now let's move on to the stop-loss in case of further market declines:
SL1 = $0.67
SL2 = $0.64
AND
SL3 = $0.56
When we look at the RSI and STOCH indicators, we can see that the indicators are low and we additionally rely on the trend line, which may affect the price maintenance.

📈🔍 MATIC Long Trade Analysis 🔄💼Trade Overview:
MATIC has shown strong support around the $0.67 level for almost a month, making it an opportune level for entering a long spot trade.
Trade Setup:
Entry: Enter into a long spot trade at the $0.67 level of support.
Take Profit: Aim for profit targets at $0.85 - $0.90 and the next resistance area at $1.07 - $1.15.
Stop Loss: Set the stop loss just below $0.65 to manage risk effectively.
📊🛡️ Exercise caution and closely monitor MATIC's price movement for trade management! #MATICTrading #CryptoAnalysis 📉🚀

MATIC ANALYSIS (2H)MATIC seems to have formed a diametric from the bottom on the hourly time frame.
It now appears to be in the middle of wave E.
In the supply range, you can look for sell/short positions (scalpi).
Closing a 4-hour candle above the invalidation level will violate the analysis
For risk management, please don't forget stop loss and capital management
Comment if you have any questions
Thank You

MATIC BULLS TO TAKE OVERHello Traders and everyone, I am Hadi Karaali, Known as SNIPERS_FX
If you like the idea, do not forget to support with a like and follow.
MATIC BULLS TO TAKE OVER. 📚
👉As we can see price was overall bearish making clean lower lows and lower highs, Moreover, and recently price got stuck inside this range, where the price is sitting around our support zone.
👉Meanwhile, we are interested in looking for new longs as we are around our support zone, and for the bulls to take over, we need a break above the upper bound of this range, Then a movement higher would be expected.
👉Unless price managed to break below our lower bound, then our bearish movement will be extended.
If you like this kind of analysis don't forget to like and follow
and as usual follow your trading plan and manage your risk.
Be patient and good luck!

MATIC AnalysisMATIC Analysis
MATIC has failed to close below the 78.6% retracement of the larger range and continues to make higher lows. MATIC has likely made a short term low earlier today. Further upside can be expected as long as the price does not close below $0.664 . A break out will be confirmed above $0.755 .

Polygon Matic price is at the bottom of global consolidationDuring the recent correction of the crypto market, the price of #MATICUSDT fell quite a bit, as for an altcoin from the top 20
However, the aggressive buyback of CRYPTOCAP:MATIC started from the critical zone, and this is good. Perhaps it was around $0.60 that big money was ready to buy.
Whether this is true or not, we will soon find out, because if the price of the #Polygon token is to start its upward trend, it should not more allowed to fall below $0.60
_____________________
Did you like our analysis? Leave a comment, like, and follow to get more

MATICUSD 1WMATIC ~ 1W
#MATIC Continuing to maintain this pattern so far. Make purchases gradually within this pattern, with a target of at least 20%+

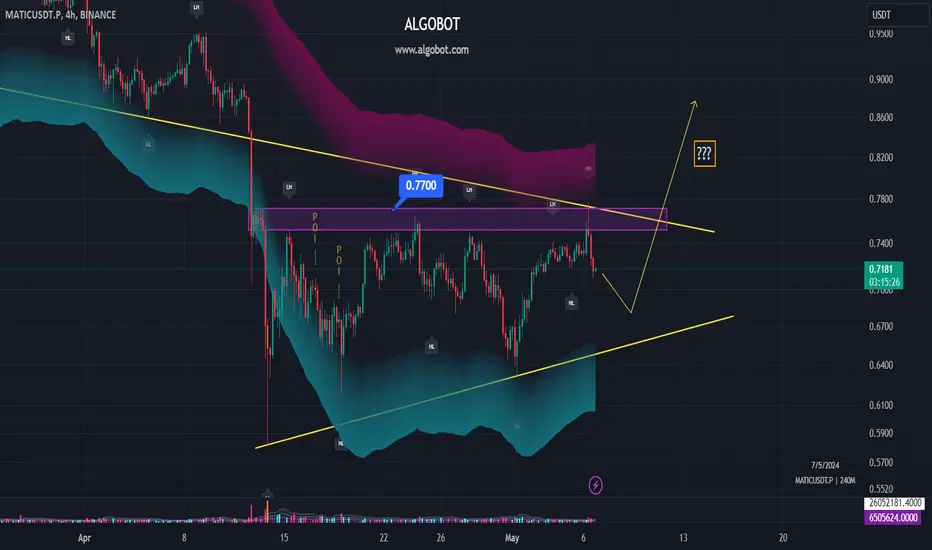
MATIC 4H analysis - May 06 2024A good 4H candle close above 0.77 area will trigger a low risk long position for Matic.
the break of upper trendline and 0.77 R/S zone shall result in a pump in this coin.
Polygon MATIC Intraday Trade SetupThe chart highlights breakout/rejection points, criteria, and targets to execute on the trade opportunity.

Matic Reaccumulation Trading Range This local trading range occurs at the resistance of the greater trading range so there is a strong change if reversal.

MATIC Long - Please Read the Note Buy Around- 0.73 - 0.71
Targets :
TP 0.759
TP 0.830
TP 0.895
Stop : 0.6890 (If both entries are activated..it is less than 3.00%) )
Note :
1- If TP1 Hit Move stoploss to entry
2- Use the Smallest Amount and dont use leverage
Enjoy

Matic USDTMATIC Setup. After a confirmed breakout from the marked zone in green, we could take an entry at 0.7924. Remember stop loss is your friend. Everything is on the chart.
Entry 0.7924
S.L 0.7092
T.P 1 0.8598
T.P 2 0.9483
T.P 3 1.0664
T.P 4 1.1854

#MATIC Spot Opportunity#MATIC Spot Opportunity
Breakout of main resistance trendline.
Waiting for Ascending Triangle breakout.
Will DCA from now

📈MATIC Analysis: Waiting for Box Breakout in 4-Hour Timeframe🚀🔍Today's market saw a notable rebound from a crucial support level, reaffirming the buying opportunity for investors keen on sustaining prices above this support. As emphasized in previous analyses, the breach of this support and subsequent consolidation below it would likely signal a bearish trend, making position opening challenging until proximity to this support.
⚡️Currently, Bitcoin has undergone a minor upward correction, with altcoins also nearing the upper bounds of their respective boxes. The coin under scrutiny today is Matic (MATIC), with analysis focused on the 4-hour timeframe. Matic is currently confined within a box ranging from 0.6449 to 0.7491.
🔔Utilizing the volume fixed range profile indicator reveals balanced volumes within the box, suggesting a prudent approach of waiting for a breakout before considering positions. Therefore, the entry point for a long position is at 0.7491, while for a short position, it's at 0.6449.
📈For long positions, consider targeting the area around 0.8685, a strong supply zone where price rejection may occur. Conversely, for short positions, 0.5057 serves as a suitable target, offering robust support and aligning with the 1 Fibonacci extension.
✅However, the optimal exit strategy entails waiting for a trend reversal before exiting the position. This advanced approach necessitates a deep understanding of market dynamics and significant trading experience.
📊Additionally, dwindling volumes indicate waning trader interest within this range. When traders, especially those with significant trading volumes, are disinterested, it's prudent for others to refrain from trading.
💎For RSI confirmation, breaking above 64.27 could serve as a signal for long positions. However, given the market's lack of momentum, reliance solely on momentum indicators like RSI may not be advisable.
📝In conclusion, exercising patience for a breakout from the current box range is prudent for Matic traders, with strategic entry and exit points crucial for successful trading amid prevailing market conditions.

⚡️MATIC: Disney's Crypto Of ChoiceMatic Polygon, formerly known as the Matic Network, is a Layer 2 scaling solution for the Ethereum blockchain. It was rebranded in 2021 to Polygon Technology to reflect its expanded scope and mission. The platform aims to improve the scalability and usability of Ethereum by providing a framework for building and connecting Ethereum-compatible blockchain networks. The native token of the Polygon network is MATIC, which is used for various purposes within the ecosystem, such as transaction fees and staking. Polygon offers a solution to the challenges faced by the Ethereum network, including slow transaction processing BINANCE:MATICUSDT times and high transaction fees, by enabling faster and cheaper transactions.
