MBOX/USDT supper bullish MBOX/USDT successfully broke its multi-month descending downtrend on June 26, followed by a clean retest with strong volume—a clear indication of buyer dominance.
On July 7, bulls made another decisive move by reclaiming the critical $0.05 resistance, flipping it into new support.
Currently, price

MBOX/USDT – Pullback After Breakout, Retest UnderwayMBOX broke out from a falling channel and rallied toward $0.056. However, it faced rejection and is now pulling back, possibly to retest the breakout zone (purple box). If this level holds, we may see another leg up.
Setup Summary:
Broke out of downtrend channel
Retesting consolidation zone (marked
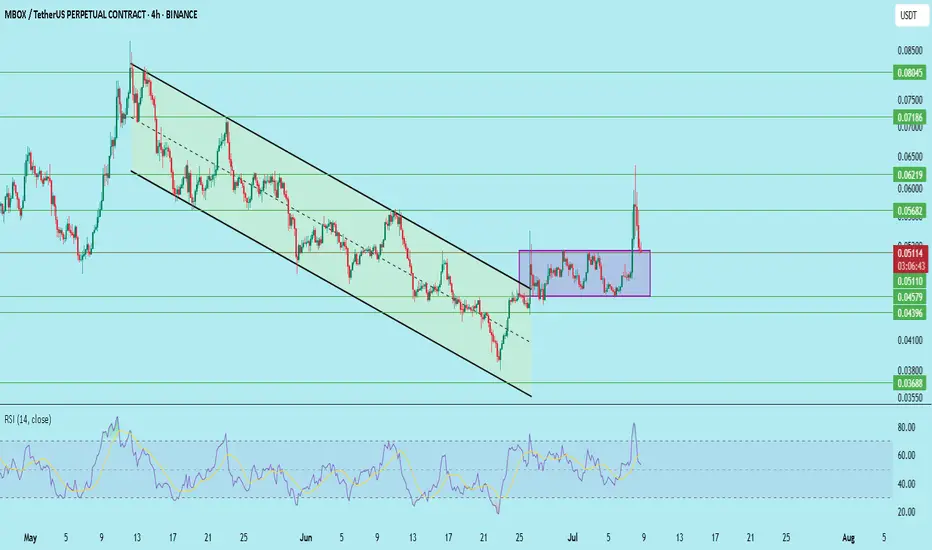
MBOX Broke above the Resistance!MBOX Price Analysis – Daily Timeframe
Hello Traders,
Today, let's analyze MBOX on the daily timeframe.
MBOX has broken above both the resistance trendline and the 50 EMA. This breakout looks promising, and based on the current price action, we may see a retest toward the 50 EMA, followed by a pot

MBOXUSDT 1D#MBOX is moving inside a Descending Broadening Wedge on the daily chart.
In case of a breakout above the pattern resistance and the daily EMA50, the targets are:
🎯 $0.0597
🎯 $0.0742
🎯 $0.0859
🎯 $0.0975
🎯 $0.1141
⚠️ Always use a tight stop-loss to manage risk and protect your capital.

Ready to Explode $MBOXUSDTAfter make a new All Time low, this pair finally brekout from mini trendline and try climbing for the next stage to breaking a bigger trendline, Watch and see

MBOXUSDT 1D#MBOX has broken above the descending resistance on the daily chart. A retest is currently in progress. In case of a successful bounce and a breakout above the Ichimoku cloud, the targets are:
🎯 $0.1103
🎯 $0.1560
🎯 $0.1929
⚠️ Use a tight stop-loss.

#MBOX/USDT#MBOX
The price is moving within a descending channel on the 1-hour frame, adhering well to it, and is on its way to breaking it strongly upwards and retesting it.
We are seeing a bounce from the lower boundary of the descending channel, which is support at 0.0551.
We have a downtrend on the RSI

MBOXUSDTMBOXUSDT, from my perspective, is a currency that I believe has potential on a medium-term basis. I have identified key resistance areas that are likely to turn into support once reached, and the price should respect these levels during corrections.
Please note that trading is done at your own resp


MBOXUSDT 1W#MBOX is moving inside a descending channel on the weekly chart and is currently within its support zone. If it loses this support zone, it may retest the support level of $0.0798.
The mid-term and long-term targets are:
🎯 $0.3276
🎯 $0.5570
🎯 $0.8752
🎯 $1.6850

See all ideas
Summarizing what the indicators are suggesting.
Oscillators
Neutral
SellBuy
Strong sellStrong buy
Strong sellSellNeutralBuyStrong buy
Oscillators
Neutral
SellBuy
Strong sellStrong buy
Strong sellSellNeutralBuyStrong buy
Summary
Neutral
SellBuy
Strong sellStrong buy
Strong sellSellNeutralBuyStrong buy
Summary
Neutral
SellBuy
Strong sellStrong buy
Strong sellSellNeutralBuyStrong buy
Summary
Neutral
SellBuy
Strong sellStrong buy
Strong sellSellNeutralBuyStrong buy
Moving Averages
Neutral
SellBuy
Strong sellStrong buy
Strong sellSellNeutralBuyStrong buy
Moving Averages
Neutral
SellBuy
Strong sellStrong buy
Strong sellSellNeutralBuyStrong buy
Displays a symbol's price movements over previous years to identify recurring trends.