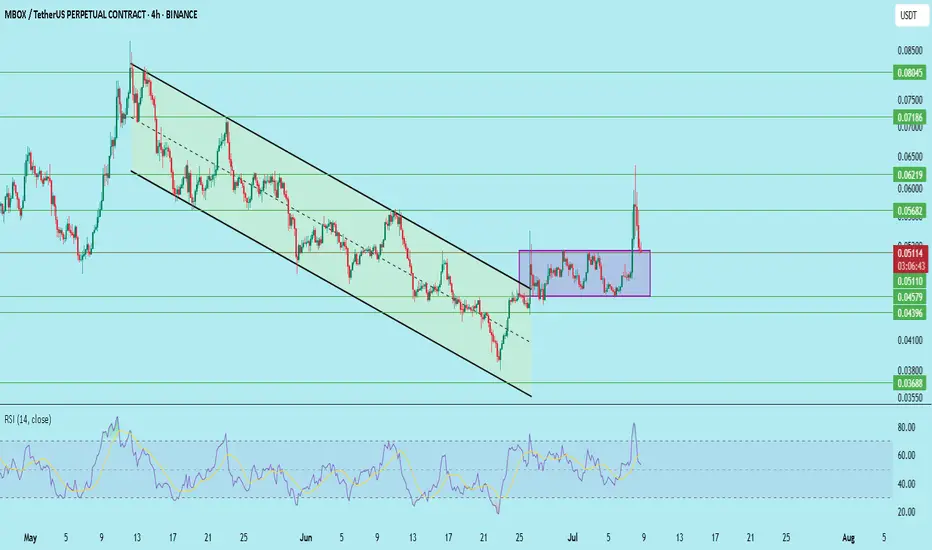
MBOX/USDT – Pullback After Breakout, Retest UnderwayMBOX broke out from a falling channel and rallied toward $0.056. However, it faced rejection and is now pulling back, possibly to retest the breakout zone (purple box). If this level holds, we may see another leg up.
Setup Summary:
Broke out of downtrend channel
Retesting consolidation zone (marked in purple)
RSI cooled off after touching overbought — bullish structure intact
Key Levels:
Entry: $0.050–0.0512
Stop Loss: $0.04421
Targets:
T1: $0.0568
T2: $0.0621
T3: $0.0718
T4: $0.0804
Support Levels: $0.0457 / $0.04421
A successful bounce from this range could reignite momentum.
DYOR. Not financial advice.
MBOXUSDT.P trade ideas
MBOX Broke above the Resistance!MBOX Price Analysis – Daily Timeframe
Hello Traders,
Today, let's analyze MBOX on the daily timeframe.
MBOX has broken above both the resistance trendline and the 50 EMA. This breakout looks promising, and based on the current price action, we may see a retest toward the 50 EMA, followed by a potential rebound.
Strategy:
~ A good entry would be between $0.05 and $0.055
~ Target: $0.075 – $0.082
~ Trade Type: Spot / 3x Leverage
Please Note: Always conduct your own research and analysis before investing.
Regards,
Team Dexter

MBOXUSDT Forming Descending WedgeMBOXUSDT is catching the eye of many traders right now, as its technical setup hints at a significant upside potential in the near term. With volume picking up and market participants showing renewed interest, MBOX is forming a strong base that could lead to a powerful rally. The current price action suggests that bulls are quietly accumulating positions, preparing for a breakout that could deliver gains in the range of 90% to 100%+.
In the broader crypto market, MBOX continues to gain traction thanks to its unique position in the GameFi and NFT sectors. As more investors look for projects with real-world use cases and active ecosystems, MBOX stands out for its innovative approach and growing community support. This underlying strength provides additional confidence that once momentum builds, the move could be both sharp and sustained.
From a technical perspective, traders should watch for confirmation signals such as a breakout above recent resistance levels or a decisive increase in buying volume. These clues could validate the bullish scenario and trigger fresh entries from trend-following traders and swing investors. With favorable market conditions and clear risk management, this trade setup aligns well for those seeking high-potential altcoin plays.
✅ Show your support by hitting the like button and
✅ Leaving a comment below! (What is You opinion about this Coin)
Your feedback and engagement keep me inspired to share more insightful market analysis with you!

MBOX/USDT supper bullish MBOX/USDT successfully broke its multi-month descending downtrend on June 26, followed by a clean retest with strong volume—a clear indication of buyer dominance.
On July 7, bulls made another decisive move by reclaiming the critical $0.05 resistance, flipping it into new support.
Currently, price has retraced back to the $0.05 zone, presenting a high-probability entry for DCA (dollar-cost averaging). This area previously acted as major resistance and is now serving as a solid support base.

MBOXUSDT 1D#MBOX is moving inside a Descending Broadening Wedge on the daily chart.
In case of a breakout above the pattern resistance and the daily EMA50, the targets are:
🎯 $0.0597
🎯 $0.0742
🎯 $0.0859
🎯 $0.0975
🎯 $0.1141
⚠️ Always use a tight stop-loss to manage risk and protect your capital.

Ready to Explode $MBOXUSDTAfter make a new All Time low, this pair finally brekout from mini trendline and try climbing for the next stage to breaking a bigger trendline, Watch and see

MBOXUSDT 1D#MBOX has broken above the descending resistance on the daily chart. A retest is currently in progress. In case of a successful bounce and a breakout above the Ichimoku cloud, the targets are:
🎯 $0.1103
🎯 $0.1560
🎯 $0.1929
⚠️ Use a tight stop-loss.

#MBOX/USDT#MBOX
The price is moving within a descending channel on the 1-hour frame, adhering well to it, and is on its way to breaking it strongly upwards and retesting it.
We are seeing a bounce from the lower boundary of the descending channel, which is support at 0.0551.
We have a downtrend on the RSI indicator that is about to break and retest, supporting the upward trend.
We are looking for stability above the 100 Moving Average.
Entry price: 0.0580
First target: 0.0634
Second target: 0.0666
Third target: 0.0713

MBOXUSDTMBOXUSDT, from my perspective, is a currency that I believe has potential on a medium-term basis. I have identified key resistance areas that are likely to turn into support once reached, and the price should respect these levels during corrections.
Please note that trading is done at your own responsibility; the above is merely my opinion.


MBOXUSDT 1W#MBOX is moving inside a descending channel on the weekly chart and is currently within its support zone. If it loses this support zone, it may retest the support level of $0.0798.
The mid-term and long-term targets are:
🎯 $0.3276
🎯 $0.5570
🎯 $0.8752
🎯 $1.6850

MBOXUSDT: Minimum 183% Potential Move Ahead!🚀 MBOXUSDT: Minimum 183% Potential Move Ahead!
🧐 Analysis:
Massive Move Expected – Minimum 183% Potential 📈💥
Strong Market Structure Setup – Ready for a big move 🔥
Key Levels to Watch: Keep an eye on critical zones for entry 🚀
🎯 Plan: Watch closely for entry points, this one could deliver a huge upside! 💡📊

an insight on MBOXBINANCE:MBOXUSDT
MBOX is in a falling wedge pattern which is a bullish pattern.
a break out is about to happen!
the price shall reach the top of it once again!
the following prices that are shown on chart can be targets!
⚠️ Disclaimer:
This is not financial advice. Always manage your risks and trade responsibly.
👉 Follow me for daily updates,
💬 Comment and like to share your thoughts,
📌 And check the link in my bio for even more resources!
Let’s navigate the markets together—join the journey today! 💹✨

#MBOX Ready for a Pullback or Will it Fall Further? Key LevelsYello, Paradisers! Is #MBOX gearing up for another rally, or are we facing a deeper pullback to shake out the weak hands? Let's break down the latest analysis of #MOBOX:
💎#MBOXUSDT has been trading within a well-defined Descending Channel since its peak earlier this year. It has recently shown signs of strength by breaking out of the channel resistance while sweeping liquidity near $0.35 and then reversing. Currently, the asset is coming down to the lower support zones for a liquidity capture.
💎The $0.38–$0.42 range is a critical supply area where the profit-taking wave comes into play. For any sustainable rally, #MBOXUSD must clear this zone decisively as it has historically served as a rejection point.
💎If AMEX:MBOX maintains support above $0.17 and builds momentum, we could see a powerful surge toward the $0.38-$0.42 resistance zone. Breaking above $0.42 would unlock further upside, with potential targets around $0.50 or even $0.55. However, bulls need strong volume and conviction to fuel this breakout.
💎The support zone between $0.17 and $0.119 remains the Bulls' primary defensive line. A daily candle closing below the $0.119 support level would invalidate the bullish thesis, paving the way for a potential drop toward $0.10 or lower.
Stay focused, patient, and disciplined, Paradisers🥂
MyCryptoParadise
iFeel the success🌴

MBOXUSDT 6DMBOX ~ 6D
#MBOX If you still have Conviction on this coin,. Gradual buy back on this support block,. with a minimum target of 20%++


Hypothetically cup and handleAssuming you find:
- Cup Bottom: $0.25
- Cup Top: $0.35
- Handle Breakout Point: $0.30
Target Price Calculation
- Cup Depth: $0.35 - $0.25 = $0.10
- Target Price: $0.30 + $0.10 = $0.40

Mboxusdt trading opportunityMBOX is currently forming a descending broadening wedge, a pattern typically associated with the conclusion of a downtrend. The strategic plan involves accumulating the coin near the defined buyback area, as there are indications that the bottom may already be in place.
This setup anticipates a breakout from the wedge, targeting the larger projection of the pattern, which aligns with a potential price move toward $4 as shown on the chart.
However, caution is essential. A descending broadening wedge can take longer to confirm its breakout, and any unforeseen increase in selling pressure could delay or invalidate the bullish scenario.

MBOXUSDT 1WMBOX ~ 1W
#MBOX If you still have Conviction on this coin,. Buy gradually from here with a minimum target of 20%+. It is only a matter of time until this resistance line is broken.

MBOXUSDTHMT v1.0 spotted. Looking good with previous wave up with increasing volume and momentum.
- BOS (Breaks of Structure) at @ 0.2140-0.2215 level
- Trending slow and steady if able to hold above the BOS level
It is at extremely good reward to risk level.

Immediate Entry Strategy for MBOXUSDTTrade Setup:
Entry Price: Immediate entry at $0.1969 (current market price).
Stop-Loss: Place at $0.1833
Take-Profit Target: $0.2385, based on the 1.618 Fibonacci extension.
Why Immediate Entry Works:
Bullish Continuation: The price is consolidating near the 0.5 Fibonacci retracement, which is often a strong level for a continuation move.
Support Confirmation: The 200 SMA at $0.1829 is a reliable dynamic support level, adding confidence to the bullish bias.
Momentum Potential: An upward bounce from the current levels suggests a possible rally toward the 1.618 extension at $0.2385.

MBOXUSDT - pump soon? Capitulation zone, came in a large volume, also added this coin on futures, including on binance, if memory serves. It's about to go up strongly

MOBOX ATH & 525% Growth Potential (Short- & Long-Term)Here we have MBOXUSDT, it has the same pattern as many other pairs but with the difference that the 5-August drop produced a true bottom, an All-Time Low.
This is a major low compared to October 2023 and thus a recovery wave is probable and highly likely. In fact, the next move can develop into an uptrend but with this type of chart setup the minimum we get is a relief rally or recovery wave, and this is enough for a trade.
➢ The first target/resistance stands at MA200 for 55%. This is a super easy target and can hit within days.
➢ The 195% target, or a little lower, is also high probability because it is a lower high compared to March.
➢ The last target shown on the chart, 525%, can be definitely hit long-term but in the mid or short-term is more questionable because this would be a higher high and the highest level since June 2022. So it might require some up, down, up and down before finally reaching it.
All in all, this looks good to accumulate with a focus on the long-term. As shown above, this pair can also be approached with a short-term perspective.
Thank you for reading.
Namaste.
