When markets give you clues...will you see the clue?9.26.21 When markets give you clues...will you see the clue? Dogecoin; Copper Part 1 Part 2 will show a chart of someone who must be following me; there are some things I believe he might be overlooking.
Copper Futures
COPPER1! trade ideas


copper9.21.21 Copper Part 2 or 3?: Looking for reversals at high...how they look...market dynamics using presses and gaps etc. This takes a little bit of thought...but may be helpful for some traders...but you have to work with it to see if you are compatible.


HG1! Copper coming in for the bounceIH&S there bouncing off the bottom of a channel.
YEAH it's an excursion from the channel, that's ok! The head was too.
Look at the RSI70! AND UP WE GO!

Copper prices eye key support to resume downtrendCopper prices are recoiling from confluent resistance at 4.4620. This is marked by the underside of two recently-broken uptrend supports, the upper bound of a seven-month price congestion zone, and a downward-sloping trendline emanating from the May 10 high. A daily close under swing-low support at 4.2060 may act to confirm downtrend resumption, initially setting the stage for a test below the 4.00 figure.


New trading strategy upgrade - Coppercorrection then go up to a daily resistant level. still have buy opportunities!

COPPER best time to buy now. 2 year rally ahead.This is COPPER on the 1W time-frame. I've made this idea to show to long-term investors why the metal is currently on the most optimal buy levels ahead of a two-year rally.
As you see, the price has been rising since the August pull-back. Not only is it posting a recovery but the August low happened almost on the 1W MA50 (blue trend-line), which has been the markets major Support since the June 2020 bullish break-out.
The pattern bears strong resemblance with the 2004 fractal. As you see both Cycles made a Double Bottom, which initiated the rally, a 1W Golden Cross was formed along the way and when the price hit the Resistance of the previous Cycle High, it made the first substantial correction/ pull-back. In both cases, the 1W MA50 held and then a 1 year Channel Up followed supported by the 1W MA50, which eventually paved the way for the final parabolic rally. The RSI sequences are also quite similar.
It is obvious the Copper is replicating the previous Bull Cycle and since the 1W MA50 held so emphatically, it is most likely the most optimal level to buy on the long-term.
** Please support this idea with your likes and comments, it is the best way to keep it relevant and support me. **
--------------------------------------------------------------------------------------------------------
!! Donations via TradingView coins also help me a great deal at posting more free trading content and signals here !!
🎉 👍 Shout-out to TradingShot's 💰 top TradingView Coin donor 💰 this week ==> Vergnes
--------------------------------------------------------------------------------------------------------

Copper Wyckoff distribution idea!Hello my beauties.
The arrows don't reflect an accurate prediction of what the price will do, just a rough idea of the areas that I'm expecting the price to move towards.
For all the ones that have taken the trade already, good job!
Copper has just entered a phase of distribution and I want to profit from it while it's rangebound.
I will be long until the price reaches above the Buying Climax (BC).
If you find this idea to be helpful like, follow, and drop a comment below if you'd want me to analyse a different pair.
Consider supporting me if you think I am providing you with value.
Peace.
Luca, TrickleDownFX

$COPPER Looking for Rally$COPPER has produced an inverse head and shoulders pattern and looks to have tested the neckline. If this pattern plays out, it should see about an 7% rally.

HG1! Daily TimeframeSNIPER STRATEGY
This magical strategy works like a clock on almost any charts
Although I have to say it can’t predict pullbacks, so I do not suggest this strategy for leverage trading.
It will not give you the whole wave like any other strategy out there but it will give you huge part of the wave.
The best timeframe for this strategy is Daily, Weekly and Monthly however it can work any timeframe above three minutes.
Start believing in this strategy because it will reward believers with huge profit.
There is a lot more about this strategy.
It can predict and also it can give you almost exact buy or sell time on the spot.
I am developing it even more so stay tuned and start to follow me for more signals and forecasts.

Mcx Copper AnalysisThis is analysis of copper in the triangle formation pattern (33333) of wave analysis.

Mcx Copper anylisisThis is anylisis of copper and it's in the triangle formation pattern (33333) of wave analysis.

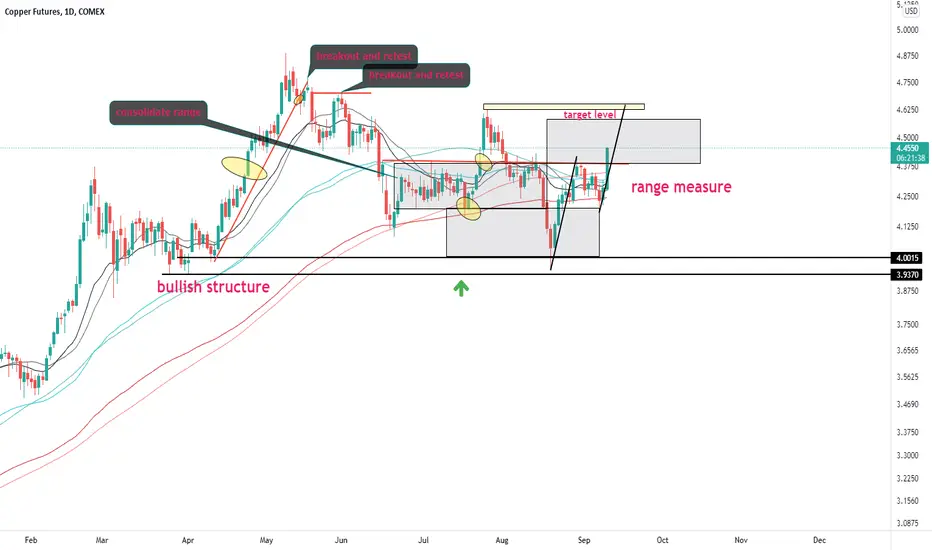
JICPT| Copper broke the range moving on to next one!Hello everyone. Fundamentally, copper is used in everything from wiring to electronics, and electrical cars. It is regarded as a leading indicator of global economy.
Previously, I've published ideas about copper and projected price by measured move. Now, price has finally broken out the range. What' next?
Again, I replied on abcd pattern and measured move(range). The target is previous high level of 4.62ish.
It's quite simple and easy to understand. What's your opinion?
Give me a like if you're with me.
Copper breakout price targetwere at the 0.5 fib now, which is also the trendline for the descent, and just above the daily 200
if we go through here, retesting the highs but likely next upward target is the 1.618 fib at 900

Copper: lifting its head?Above 4.35 supports a bullish trend direction.
Drifting of the MACD supports a bullish trend direction.
Wait for the trend to develop further for some confirmation.
Remains above its 200-day simple moving average supporting a bullish trend.

DXY COPPER9.13.21 This is about comparing the DXT to Copper Range of price and volatility. I'm sure this is taught somewhere, but this is something that I had to derive on my own and it took me many years before I had a conscious awareness of behaviors that would become important priorities for my trade decisions. This is not an eloquent presentation, and it may be incomplete, but it's something that I processed into my trade decisions consistently even though it is not perfect. So factoring in warts and all, I would suggest that you spend an hour or so, try to duplicate the patterns, and calculate the numbers for yourself, and then decide if it has any value for you or not. This is because I don't think it's that easy to find information like this, yet you have to decide if it has any meaning for you or not. One of the biggest conundrums of trading is that you hear what wise people tell you you need to do... Such as " trade what you see," when you really don't know what that means. I have chosen volatility and price range into my decision-making. I am not an educator and a teaching scholar. My mission was to trade better for myself, and then help a few friends that could use some help. You have to think about volatility and ranges in my opinion, there really is no choice as I see it. But you have to decide. It's worth an hour or two of your time. I only wish I had only wasted a couple of hours of my time learning what I needed to know.

New trading strategy upgrade - CopperCopper is on a correction on a 60k chart and let's wait for buys from resistant level on daily chart

Copper has just entered a Wyckoff Distribution!Hello all.
I think that Copper has just entered a phase of distribution, and I will be longing it for the formation of an Upthrust that will bring the price beyond the Buying Climax.
Like if you enjoy the idea, and consider following and supporting me.
Peace.
TrickleDown FX

Copper9.9.21 Copper I plan to post more on copper. The specific reason for talking about this market has to do with how I make distinctions about probability and markets that are not likely to break out, versus markets that will reverse and go in the opposite direction.

Copper The pullback in copper ended up being a three wave rise wherein it retraced slightly more than 61.8% retracement in international copper chart of wave Y.
This opens up the possibility of one more leg to the down move in the form of wave Z.
Overall look
Retracement levels in copper international chart
MCX chart retracement
Weekly macd bearish
Daily macd below zero line and down tick
Rsi in Weekly down tick
Rsi in daily down tick
Dmi adx also Negative
Below middle bollinger band
Disclaimer
I am not sebi registered analyst
My studies are Educational purpose only
Consult with your Financial advisor before trading or investing

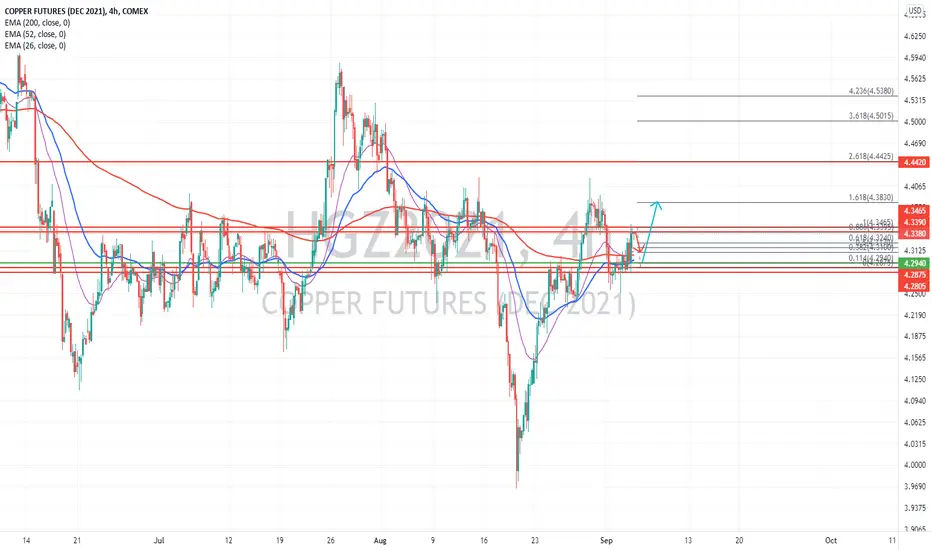
Copper uptrend still validShort term movement looking short position at price 4.3390-4.3395 target at 4.310.
Long position at price 4.2940 target 4.3395 & 4.3830 in extension.
Provided support 4.2805 still strong.
TAYOR