just an ideafind it interesting, this is the sum of all commodities divided by the money supply.
probably doesn't mean anything, anyway interesting.
Looking at the parabolic route of m2 and the commodities basket divided by it didn't move as expected because of it's rally the rally. lot's of money still in the markets.
give me your perspective and ideas
Copper Futures
COPPER1! trade ideas

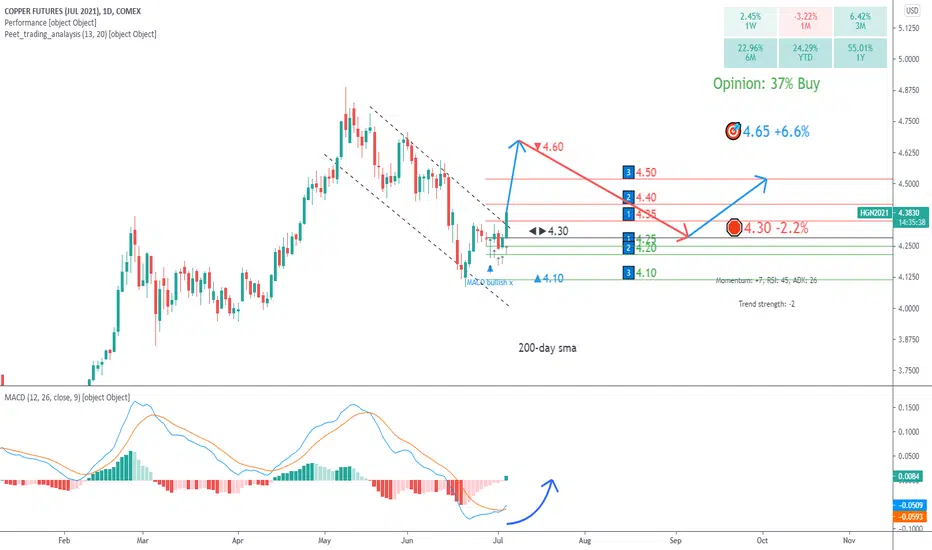
Copper back up to $4.40 ?Coppers trading range is narrowing quite a bit.
initially i got my timiing wrong on this (see other analysis), but now seems to be teh right time for a reversal breakout upwards.
expect copper to head up to $4.40. will need to reassess there to decide which way next.
overall long term expecting copper down.

Copper: testing major resistanceThe price action is testing major resistance.
A price action above 4.30 supports a bullish trend.
Upside price momentum also favours the bullish trend.
MACD bullish crossover confirmed a change in trend direction to bullish.
RSI leaves enough room for further upside price potential.
Copper Selling WinnerCopper this morning was in a slow fall getting pressure from PSAR so I put in a sell order at 4.3295 seeing if price action would break down past 4.3 - Once it did it quickly hit my Take Profit of 100 points, my usual for Copper, at 4.3195. Now to monitor to see if Price Action will reverse and I can do it all again on the way up :-)

ridethepig | Copper for the Yearly Close📌 Copper for the Yearly Close
First with an immediate review of the flows.
We were tracking for the capitulation low which was our moment to advance...
It was a great choice of moment to load the longs.
Extending the belief in commodity shortages which have been entering into play all year long. The highs are worth striving for, all factors remain the same with the macro picture still equal. The main cases where this will play an additional note too at China and Australia flows which is something to consider.
After clearing our first targets it's time to aim for the 4.5 main impulsive zone. A flyaway break is in play with such a bullish close, which is generally not very common. Of course the last time this happened was in the early 2000's; and we exploded.
As usual thanks for keeping the feedback coming 👍 or 👎

#Mcxcrude downward slopping channelCrude is in dwonward slopping channel between 690 to 730. A breakout above 730 closing basis it can sharply move up to 730


COPPER/ Melt down or ContinuationCatalyst would be a rallying dollar in my opinion. Copper poses a similar structure to many cryptocurrencies over the past few months.
Check comments for weekly/monthly view, where there is also huge reversal pattern.


Jun 25, 2021 Copper WinnerCopper was in a sideways pattern since about 3am. I put in a Sell order for 4.3200 in case price action moved, which it did around 7:15am. Price action moved down through my 30 HMA and I put my usual Take Profit at 100 points, 4.3100 which it did in less than 1 hour. Again, price action continued moving down but I always like to take my profit and run :-)

Jun 24, 2021 Copper Early Bird WinnerPerfect setup for Copper this morning as soon as I woke up. In checking Copper chart you can see the sideways pattern with PSAR supporting for hours. I put a buy order in at 4.2900 and just in time, because just after 6am in less than 15 minutes, price action rose straight up through my 30 HMA and hit my TP at 2.3000 for a quick 100 point profit. Great start to the morning.

copper premarket. probably getting too specific.I think copper will continue to rise. Copper is a useful metal for lots of electronic devices.
Point of control might act as a magnet to draw price higher.
In march through april copper was at a decision point, and markets decided it was in high demand. I would be surprised if price went back lower through that heavily traded range. If I was ordering copper for a large company I would probably feel like I'm getting a relatively good deal and/or a good deal may be running away from me if I don't act with haste.

Jun 23,2021 Copper WinnerCopper was in a sideways channel when I woke up and checked it out. Through the 7am hour it stayed sideways but started looking like it might break up, as my 30 HMA was starting to turn from red to green. I put a buy order in at 4.2700 with a Take Profit at 4.2800 for a quick 100 points. Then it broke up and PSAR changed it up it shot and hit my TP within 30 minutes. Great start to a Wednesday :-)

The bread and butter of global macroBefore you trade stocks, bitcoin, FX, bonds or anything you have to try and understand how our monetary system works not to miss the big picture.
This video helps you by providing a 10.000 foot view of the global macro landscape. Don't miss the forest for the trees.
Tune in and enjoy!

Copper is hit by both hike of I/R and China decision20-06-2021
In the past week, some of the inflationary pressure in the market dissipated with a major sell-off across the commodities complex. The Fed’s policy talk helped spur a surge in the dollar, which was part of the reason for the selling.
But the first catalyst was a move by China to cool the hot commodities markets. Reuters reported that a Chinese government agency planned to release reserves of aluminum, copper and zinc caused the price to plunge.
TP: $3.85


Copper - Commodities on saleSimilar to Silver, indicators at bottom.
bought 5x leverage, long.
100 MA touched and went back up.


A Quick LONG on CopperIt looks like we got a small window to LONG Copper.
Price should break out of this falling wedge pattern and retrace to 61% FIB level.
lets seee. Im going Long on this, since Copper is fundamentally strong.

Copper consolidating at key level pending rebound! Hello everyone. Copper has dropped to the key level with a big red candle yesterday! Now, the small candle indicate temporary balance between buyers and sellers.
What' next? If you look at the daily chart, this is a nice level to buy with flip zone structure.
Down below, 4.1340 is another fantastic buying level confluence with long-term MA.
Fundamentally, economy is still in the process of recovery, the pent-up demand will require more copper as it is widely used in our everyday life. In my opinion, the cycle is not over yet.
ETF would be a good option for investors to join in. CPER is the United States Copper Index Fund for your reference.
AMEX:CPER

Do we see some repeating patters with copper?Well, do we? Healthy correction. Is it time to stabilize here or are we trending towards a certain direction?

Copper Elliott Wave Idea - Bullish Cycle Started?Taking a look at something other than Crude Oil for a change.
It appears that Copper is out of a 10 year bear cycle and a bull cycle started in 2016.
A look at the beginning; you can see wave 3 hit the 4.618 extension of wave 1 perfectly and then corrected perfectly to the 0.236 level for wave 4 >
If you add in the subwaves of wave 5 there is also a nice 0.236 correction of wave 3 for wave 4 >
All that would suggest an impulse move up and 4.0505 was the end of a larger degree wave 1.
If you look at the following years from 2006 to 2016 it appears to be a multi-year correction in the form of WXYXZ > It completed at exactly the 0.618 level at 1.9300 >
Looking at recent time it looks as though the first impulse wave up is completed and now in the correction, possibly to the 0.618 retracement area before up for wave 3 >
A look at daily level we could be in wave B of Y > the 0.618 extension lines up nicely with the 0.618 retracement level.
Something to keep an eye on I think as it could turn out to be a nice long trade with a stop loss below 1.9260

