Copper waiting to cool down before another rideAnalysis: Copper is still in a strong uptrend, the industrial demand for it is in all time highs since its one of the most used commodity used by the electronics industry. Right now its price went into some overbought territory in my point of view, and I am waiting for some sideways movement before another ride to the upside.
Copper Futures
COPPER1! trade ideas


COPPER - DUE FOR A MAJOR CORRECTION?Looks like copper finally reached the top of the 5 wave impulse. We also saw an extended 5th subwave as the very last wave in the 5th wave which is typical in the commodity market. Also RSI didn't create a divergence but that is because of the extended 5th wave. We should see copper come down atleast 25-30% of it's value as a correction from the huge run it made that started early 2020. This isn't a "crash", this is just a healthy pullback before the next wave up in the future. I'm not planning on shorting it, but I did take profits on my long positions. I will look to re enter when it is done correcting.

Copper vs Kitchin cycle Copper seems to be in a topping area...
Copyright: Wikipedia
Kitchin cycle is a short business cycle of about 40 months discovered in the 1920s by Joseph Kitchin.
This cycle is believed to be accounted for by time lags in information movements affecting the decision making of commercial firms. Firms react to the improvement of commercial situation through the increase in output through the full employment of the extant fixed capital assets. As a result, within a certain period of time (ranging between a few months and two years) the market gets ‘flooded’ with commodities whose quantity becomes gradually excessive. The demand declines, prices drop, the produced commodities get accumulated in inventories, which informs entrepreneurs of the necessity to reduce output. However, this process takes some time. It takes some time for the information that supply significantly exceeds demand to get to the business people. As it takes entrepreneurs time to check this information and to make the decision to reduce production, time is also necessary to materialize this decision (these are the time lags that generate the Kitchin cycles). Another relevant time lag is the lag between the decision (causing the capital assets to work well below the level of their full employment) and the decrease of the excessive amounts of commodities accumulated in inventories. Yet, after this decrease takes place one can observe the conditions for a new phase of growth of demand, prices, output, etc.
For example, the volume of oil production on tight oil formations in the US depends significantly on the dynamics of the WTI oil price. About six months after the price change, drilling activity changes, and with it the volume of production. These changes and their expectations are so significant that they themselves affect the price of oil and hence the volume of production in the future.
These regularities are described in mathematical language by a differential extraction equation with a retarded argument.

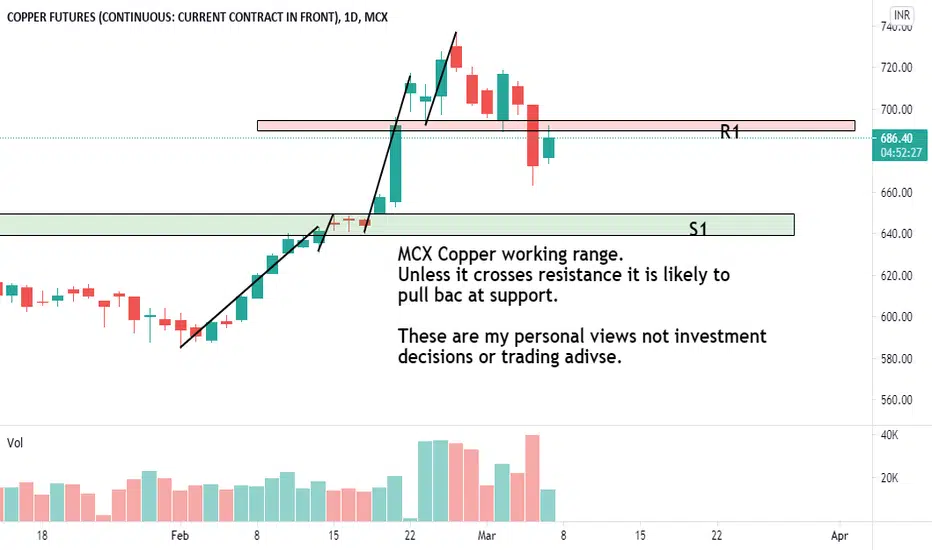
Copper Absolute analysis 02/02/2021we can see the copper in the monthly time frame that it has broken the triangle and is showing some bullish movement in the future
we may face some small downtrend but on the general trend we can be more bullish on this commodity
we have specified some levels of supply and demand where we can capitalize on
this analysis can be very useful for the swing traders and long term positional traders

View on Copper (16/3)LL after price hit resistance zone.
Waiting for price to retrace higher before deciding to short it.
entry - 4.22
Disclaimer:
The information contained in this presentation is solely for educational purposes and does not constitute investment advice. We may or We may not take the trade.
The risk of trading in securities markets can be substantial. You should carefully consider if engaging in such activity is suitable to your own financial situation.
I am not responsible for any liabilities arising from the result of your market involvement or individual trade activity


Copper bearish (March 9)Tight SL will be helpful.
Less risk, more profit
SL: 4.0090
TP: 3.9710
R/R: 1:2.04
This is for educational analysis, not for a direct trade signal.
When you check the chart, please check the resistance line and heavy support line.

Copper vs Silver Ratio ChartWhen in a commodity bull market, a rotation occurs naturally between copper and silver.
The ratio chart shows you which one should out perform.
It's now silver's turn to shine bright!

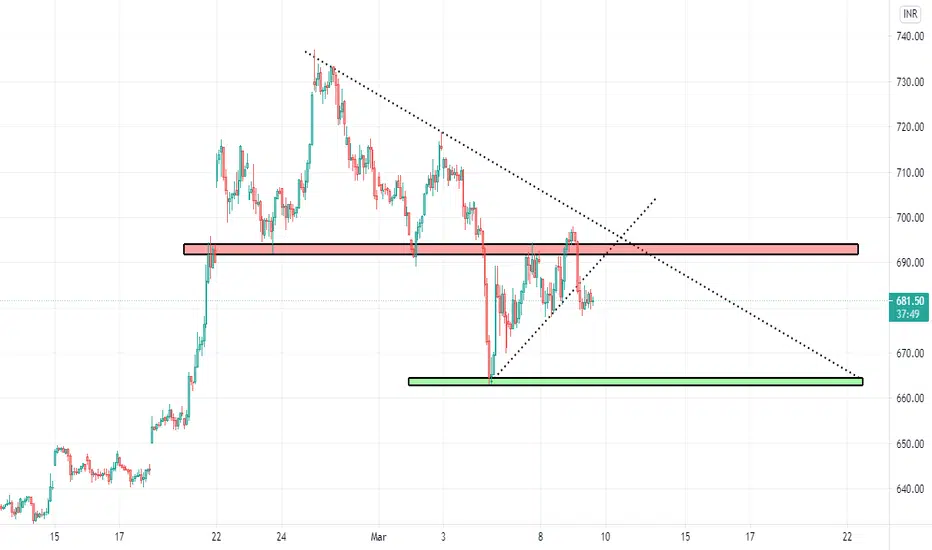
Copper Copper has respected the resistance zone and now have broken the trendline.
If after retesting of the break point zone it shoes bearish signal can further come to the marked green zone.
This is just for educational purpose.


Copper bullish (March 8/Short term)Tight SL will be helpful.
Less risk, more profit
SL: 4.0940
TP1: 4.112
TP2: 4.119
R/R: 1:1
This is for educational analysis, not for a direct trade signal.
When you check the chart, please check the resistance line and heavy support line.

Copper bearish (March 7)Tight SL will be helpful.
Less risk, more profit
SL: 4.1130
TP: 4.0850
R/R: 1:2.26
This is for educational analysis, not for a direct trade signal.
When you check the chart, please check the resistance line and heavy support line.

Copper longPrice broke two weeks downtrend with a good hourly candle.
I wait for a retest and with consider a price action, I will buy.

June 2021 - Copper 05/03 - Rebounce Sharply1. Fundamental Analysis
- After Chile's announcement about rising copper output, Congo increased production of copper and cobalt.
- Besides, US Treasury yield climbed higher, it directly made US Dollar stronger than currency peer. Therefore, this triggered a wave of sell-off from equities to commodities by funds.
- However, news comes from China that they are targeting GDP growth (at over 6%) are quite impressive. In med tern i think Copper is still good.
But near-term, long liquidation remains in place.
2. Technical Analysis.
After forming the first wave down in daily timeframe (or three waves ABC in H1). I think, Copper will rebounce sharply with three waves up as i draw in my pic.
Of course, we ne to watch close when prices likely break the downtrend in H1 timeframe.

May 2021 Copper - Corrective PatternUpdated: Corrective Pattern.
1. Fundamental Analysis
- Lack of news comes from China, which represents physical demand.
- Waiting for news from non-china (i.e USA: readings from initial claims, unemployment rate...), which show the extent each country are recovering after pandemic.
2. Technical Analysis
- Daily: Copper remains corrective pattern in daily timeframe . And it moves as Wave A-B-C as paragraph.
- In H1: I predict that Wave B are forming, and it can reach to 4.24 - 4.30.
Keep in mind that: 4.24 is resistance zone .
