XAUUSD Bearish Rejection Setup Unfolding – June 11, 2025XAUUSD Bearish Rejection Setup Unfolding – June 11, 2025 🧠🔍
📊 Technical Breakdown:
🔴 Resistance Rejection Zone (Supply Area)
Price recently tested the $3,440 - $3,460 resistance zone, marked with red arrows. This zone previously acted as a strong supply area, leading to aggressive sell-offs.
📉 Bearish Rejection Candle
A rejection occurred near the same supply zone again, hinting at a potential double top or failure to break structure. Sellers seem to defend this area aggressively.
📍 Current Price: $3,338.6
Price is hovering below mid-range resistance at $3,396.5, indicating weakness after a failed breakout.
📉 Bearish Plan in Motion:
🔁 Scenario Highlighted:
Price might retest the $3,396.5 level (purple line) before resuming the downward move (illustrated by the blue and black arrows).
A breakdown below the $3,290.3 support zone will likely trigger further downside.
🎯 Target Levels:
1st Target: $3,290.3 – Key structural support. A close below this level will confirm the bearish momentum.
2nd Target: $3,207.0 – Final support area aligned with previous accumulation zone.
🛑 Invalidation Point:
A sustained breakout above $3,460 would invalidate the bearish bias and suggest continuation to the upside.
✅ Summary:
Bias: Bearish 📉
Strategy: Sell on pullback to $3,396.5 with stops above $3,460.
Targets: 🎯 $3,290.3 ➡️ $3,207.0
Watch for a strong bearish confirmation candle below $3,290.3 to load in shorts.
🔔 Stay alert for volume spikes and lower time-frame breakdowns to fine-tune entries! 💼📊
Gold Futures
GOLD1! trade ideas

Get ready for the Breakout on GOLD!"you know how looong i been waiting for dis?!" *Gambit Voice*
Been waiting for this set up to happen and its slowly showing that its ready to break out and go for new Highs. just trying to be patient and ready for it.

Gold Futures – Double Top Leads to Bearish SetupGold Futures on the MCX chart is showing a classic Elliott Wave pattern in play. After forming a regular flat correction with a double top near the 99,300–99,200 zone, prices have started to drift lower. The double top structure—combined with the completion of Wave B—suggests that a Wave C decline is underway.
Wave A took the price down to around 90,890, followed by a corrective Wave B that failed to break the previous high convincingly.
The near-term outlook on the 4-hour timeframe remains bearish. I am anticipating five waves down within Wave C, which may take price back toward the previous Wave A low or slightly lower, possibly ending in a diagonal pattern, before a bullish reversal can be expected.
Disclaimer: This analysis is for educational purposes only and does not constitute investment advice. Please do your own research (DYOR) before making any trading decisions.

Shorting GoldWell, iam taking this trade for sure.
Iam shorting Gold again because of the following reasons.
The reason behind this trade is the IFVG that is nested withing the now resistance level (marked in black)
Secondly, there is a broken trendline that i dont think it will be reclaimed anytime soon (marked in yellow).
There are many others small details that should point toward a bearish scenario.
but on a scale from 1 to 10, how confident in my analysis iam, is 7.5.
Boost the idea if you like it : D

Waiting for Gold to Set up for the next playPrice came to my zone. Now im waiting for them to do some sweeps before they show they ready to continue. Being it is Tuesday this week they might just go for a low for the week first.

Gold ready to go down big wayGold fall has just started. the way it looks is fall is just starting.. Get ready for a huge waterfall downside. 1st tgt 3271 2nd tgt 3124. The fall is yet to start pls make a note of that.

Gold has filled in value I have been waiting to see...Looking for price to reverse from this area. Need confirmation for it first then get in on a pullback to continue.

Gold NFP delivery. Thursday High Of The Week Market ProfileCovering Gold orderflow on thursday and NFP friday with proper reasoning.


Gold exact rejection from supply zone Gold took exact rejection from supply zone . We took sell trade below supply zone sl was above the zone and target is demand zone .
Our strategy is to sell from supply or buy from demand . Today sell got active first and price moved in our direction. Waiting for target demand zone

GOLD 05.06,2025, Thursday. Day before NFPCovering my all star model. The criteria the setup the thought process and the narrative behind this model.

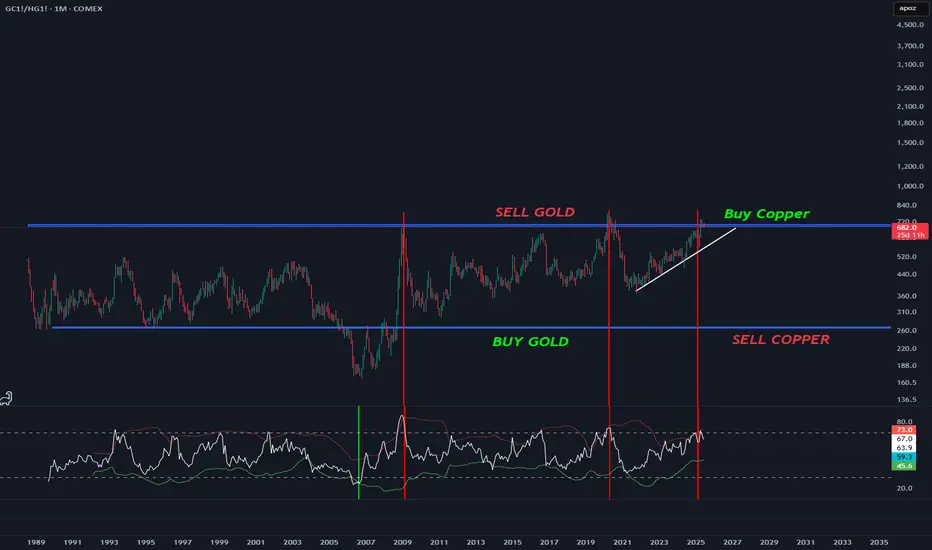
Time to SWITCH GOLD to COPPERHello. Good ? Me Yes, God you are my lord.
GOLD VS COPPER.
We are on the top. Copper will explode soon.
Be ready fokls.
If you want a safe entry : Break the white line.
LOW indicator : Time so sell...
Good luck.
STOCK era is over. Commodities will rise.
Gold took rejection from demand zoneGold took rejection from demand zone
We have intiated buy, sl below the zone and target supply zone .
Our trading strategy is to buy from demand or sell from supply

GOLD REVERESED! Looking for the breakout!We got some news Tuesday that shifted the direction of the pullback and now looking like we might just break out. if we can make it above yesterdays highs and closed on the H4 then I think it will be safe to look for higher levels. but if it breaks down from here then we could still see it reach for Liquidity. We just have to be patient in waiting for price to show its hand.

Gold Pullback Entry Opportunity Gold resumed its rally, sparked by recent tarrif news. Price is pulling back at the moment and has entered an sweet spot where we can confidently take our first low risk Buy.
BUYING HERE BECAUSE
1. We're entering into a low volume area, which is also in line with an FVG on the 1hr chart
2. When a new uptrend starts, i like to buy first 2 instances price pullback to bounce from my trend cloud indicator We didn't get a perfect bounce as it has broken below it, but i'am still buying regardless due to my first reason above about the low volume gap.
PROFIT TARGET
Setting my profit target to my trusted Exofade peak. As long as the uptrend continues, Exofade peaks will ALWAYS get taken out. That why i love this indicator, and its free. It's my gift to y'all :) . Just search for it in trading view indicators.


Short. range boundGold range bound. Possible fake out to the upside. This is just speculation. Do your own research.

Gold is Setting up for a Move! Could it be a big one?Looking for price to set up for a solid move. One thing is for sure we are waiting for the killzones before taking any action. The price action the last few days has been giving fake outs just before we roll into the killzone. Be patient. Wait for things to line up.

Scalp it or Swing it, but its bearish There is 65% chance that this trade would hit. Only time will tell though.
The upper trendline is bearish and it held for long, will whales manipulate the price and get the liquidity above then continue lower or the price will just hit lower? only time will tell.
I think maybe we will be visiting the 3000 again, hopefully soon.

gold Tesla ES versus the Russell and other markets November 2nd. gold looks bullish and may very well test the highs. I forgot to talk about silver as I was running out of time and that's trading very well and I will try to talk about silver tomorrow if I have time.

Gold Looks Bullish. But need more confirmation! Looking for more supporting signs that gold is ready to go bullish. I think it will pull back first. But waiting to see where price is at inside of the killzone before making any decision on direction. Being that it is Monday price could end up acting flaky on action. So keeping expectations low.

GOld trend directionGold 94790 is showing too congested volume pattern suggests aggressive distribution. We expect Gold will be back to its fair value 88000 to 60000 Zone ( Zone valid till Jan 26 )

Gold 01.06.2025, SundayExpecting bullish price delivery on gold to make a All Time Highs. Before the meltdown on the quarterly Fair Value Gap
