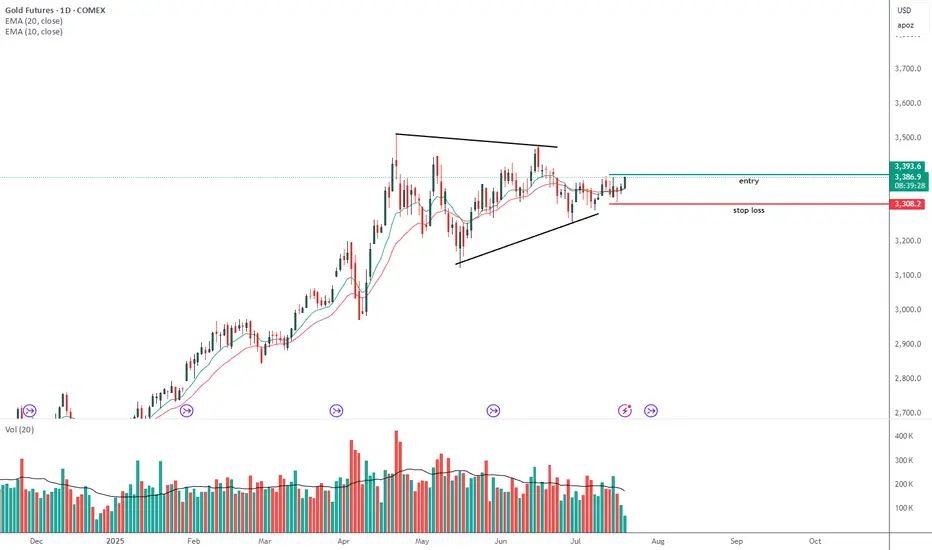
Gold Futures Update – 0.5 Fib Stop Hit, Eyes on 0.618 ConfluenceGold Futures Update – 0.5 Fib Stop Hit, Eyes on 0.618 Confluence
Our initial long setup at the 0.5 Fibonacci retracement level has been stopped out, but the structure remains constructive.
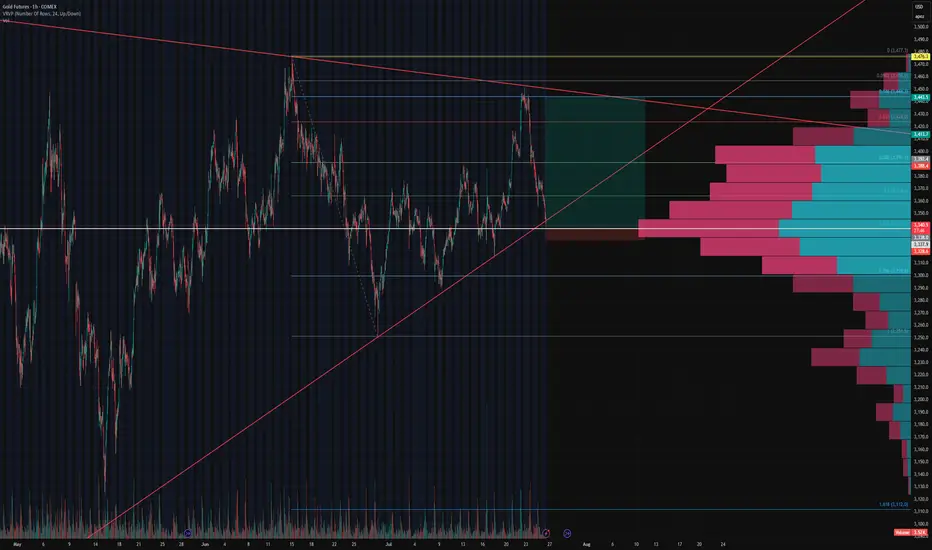
Price is now approaching a key confluence zone at $3,336 , where:
The 0.618 fib retracement from the recent swing low to high aligns perfectly,
The ascending trendline support (respected multiple times since May) intersects, and
The oint of Control (POC) from the visible volume profile shows dominant volume transacted.
This area represents a high-probability support level where bulls may attempt to defend again. We’re monitoring for reaction and potential entry signals around this level. A break below would invalidate the rising wedge structure and shift bias toward lower fib extensions.
Gold Guinea Futures
GOLDGUINEA1! trade ideas
Gold Buyers Barely Holding. Sellers Licking Their Lips.The move on gold over the last two sessions has been clean, aggressive, and very telling. Price rallied hard into a well-defined supply zone between 3452 and 3460, which has acted as a sell-side magnet for the past three rotations.
We got five separate stabs into that zone, all failing to close with strength above 3444, a key breakdown level from earlier structure. Every wick above that line was absorbed classic signs of exhaustion and seller control. That was our trigger. Once price failed to hold above 3440, the sellers unloaded. And they didn’t nibble they dumped.
What followed was a single-leg, high-momentum liquidation straight into demand at 3386–3392, wiping out all intraday longs and resetting the board. Price tagged the PDL (3386.6) to the tick, then bounced not with strength, but with stability. No strong reversal candle, no V-bottom just a hold. What that tells us is: the market’s not ready to trend yet. It’s testing intent.
Now we’re coiling between key structural levels:
- Support below: 3386 (PDL), backed by previous demand zone
- Resistance above: 3405–3410 (micro range breakdown) and 3440 (PDH)
We also have a rising trend line support running up from the July 21 low price is currently sitting right on it. That’s your structural “last chance” for bulls. Break that with volume, and the entire bullish thesis collapses short term.
My Bias Breakdown
Bullish: If we get a reclaim above 3410, then I’d target a move back to 3430, with extension toward 3444 (PDH rejection area). That’s the clean rotation if bulls can generate follow-through.
Bearish: If 3385 breaks on strong momentumbthat opens up 3355–3360, which was the last untested demand from the July 18–19 base.
Neutral (Reactive) right now. This is a trap-heavy zone. Volume is thinning out, the trendline is being tested, and both sides are probing. You don’t want to front-run here. This isn’t trend continuation yet it’s a chop filter before the next directional leg.
Key Contextual Notes
3455–3460 supply was the origin of the last two major reversals this isn’t a random level. Expect traps and stop hunts up there again if price rotates back.
3386–3392 demand has been respected across multiple sessions but it's getting tested more frequently, which means it's weakening. If it breaks clean, the unwind could accelerate.
This is a two-sided market right now. It’s not breakout season, it’s reactionary playbook time. Let the levels guide the setup, not emotion.
Trade Plan (for experienced hands only)
- Long bias: Only on 30m close above 3410 with decent volume target 3430–3444. Stop under 3385. Risk tight; momentum must confirm.
- Short bias: Rejection candle or sweep/failure at 3440–3445 OR breakdown and retest of 3385 target 3355. Invalidation on reclaim above 3410.
This is where traders get chopped to pieces, in the middle of a post-liquidation coil sitting between unfinished business above and fragile demand below. Don’t be that trader. This is where you observe, wait for intent, then strike. Trading is about timing, not guessing. Let the next move come to you. We’re ready either way.

The Edge Of The Fork - The Joker In Your PocketWOW!
\ \ First of all, I want to say THANK YOU for all the boosts, follows, and comments. You guys & gals give me the energy to continue this journey with you.\ \
Today, I want to show you that what we’ve learned with horizontal lines can also be applied to "Medianlines," or Forks.
Listen, I don’t want you to blow your brain with all the rules.
Not at the beginning of this journey, and not later on either.
Don’t ask yourself:
* when to use which Fork
* which swing to measure
* when to trade
* where to set your stop
* what if... bla bla bla
That’s not fun — that’s stress.
I don’t like stress — nobody does.
So let’s just chill and have fun here.
That’s my personal reason for doing all this Trading thing. I want to have fun — the money will take care of itself, just like the destination of a trail takes care of itself, as long as I keep putting one foot in front of the other. And that’s simple, right?
So let’s do it exactly the same way.
Just simple steps, connecting some dots, and BAM! — You’re there before you even know it §8-)
\ Let’s jump to the chart:\
Today, you’ll find out why Medianlines/Forks are a cousin of the horizontal Channel — but NOT the same.
Where are they different?
Forks are different because they’re capable of projecting the most probable path of price. And that’s a HUGE difference.
Yes, you can apply the full rule set of Forks to a horizontal Channel.
But the Channel CANNOT project the most probable path of price.
I hear you, I hear you: "No one and nothing can foresee the future. How is it even possible that Forks can?"
\ Here’s why:\
There’s a thing called "Statistical Importance." And it means that if something happens very often in the same way, we have a higher chance of seeing the same behavior again in the future.
And that’s what the inventor, Allan Andrews, discovered — and he created the rules around his findings.
\ A high probability that price will move in the direction of the projected path, as long as it stays within the boundaries of the Medianlines/Fork.\
That’s the whole "magic" behind Medianlines/Forks.
And the same applies to the "Behavior of Price" within and around Medianlines. That’s really all there is to it.
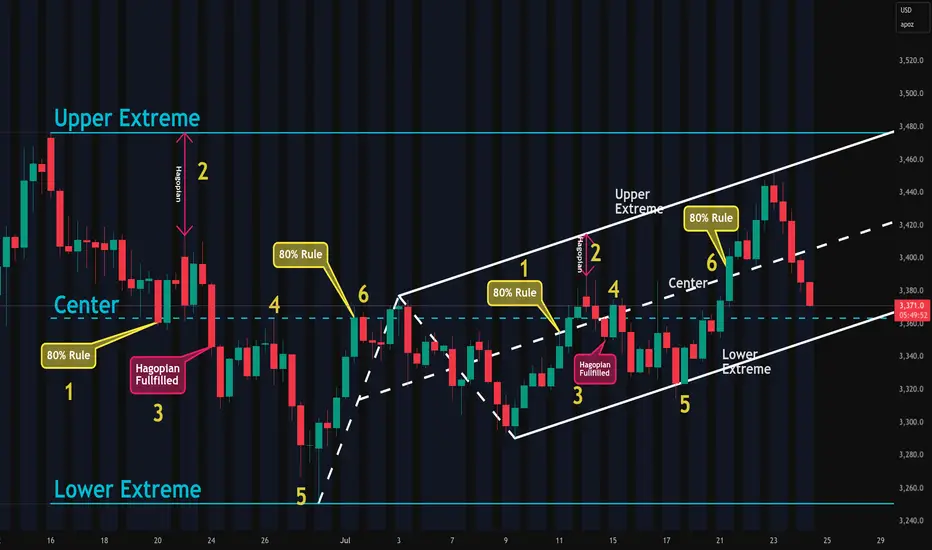
Look at the chart and compare the Channel and the Fork:
1. Price reaches the Centerline about 80% of the time
2. HAGOPIAN → price goes farther in the opposite direction than where it came from
3. HAGOPIAN’s rule fulfilled
4. Price reaches the Centerline again
5. Price reaches the other extreme
6. Price reaches the Centerline about 80% of the time
You’ll see the same behavior inside the Fork!
That’s beautiful, isn’t it? §8-)
And here’s a little Joker in your pocket — if you know the difference between the Channel and the Forks!
Do you know what it is?
Yep! You’d automatically know the direction to trade — giving you another 10% edge right out of the box — LONG TRADES ONLY. Because the Fork projects the most probable path of price to the upside, not down.
That's all folks §8-)
Like this lesson?
With a simple boost and/or a little comment, you load my Battery so I can continue my next step on the trail with you.
Thank you for spending your time with me §8-)
$GLD / $GC – Gold Poised for Breakout as Hard Assets FlexAMEX:GLD / SET:GC – Gold Poised for Breakout as Hard Assets Flex
Gold is setting up for a major breakout, and the broader market is finally catching on to the hard asset trade. Whether it’s inflation ticking up or the never-ending government deficit spending, the market is starting to signal something big.
🔹 Macro Tailwinds:
Inflation pressures + record deficit = a perfect storm for gold.
The dollar is under pressure — metals ( AMEX:GLD , AMEX:SLV , SET:GC ) are responding.
This theme isn’t going away anytime soon.
🔹 Technical Setup:
AMEX:GLD and SET:GC (Gold Futures) are coiled tightly just under breakout levels.
Volume is steady, and momentum is building under the surface.
A move through current resistance could send this entire trade into overdrive.
🔹 My Positioning:
1️⃣ Options: Long AMEX:GLD calls with 1-month expiration — slow mover, but clean structure.
2️⃣ Futures: Trading SET:GC contracts on the breakout side.
3️⃣ Silver Exposure: Still holding partials in AMEX:SLV — it’s following gold’s lead but with more juice.
Why I’m Focused Here:
This is not a one-day theme — hard assets are becoming a rotation trade.
If this confirms, we could see multi-week upside in precious metals.
It’s rare to get clean technicals that align this well with macro.
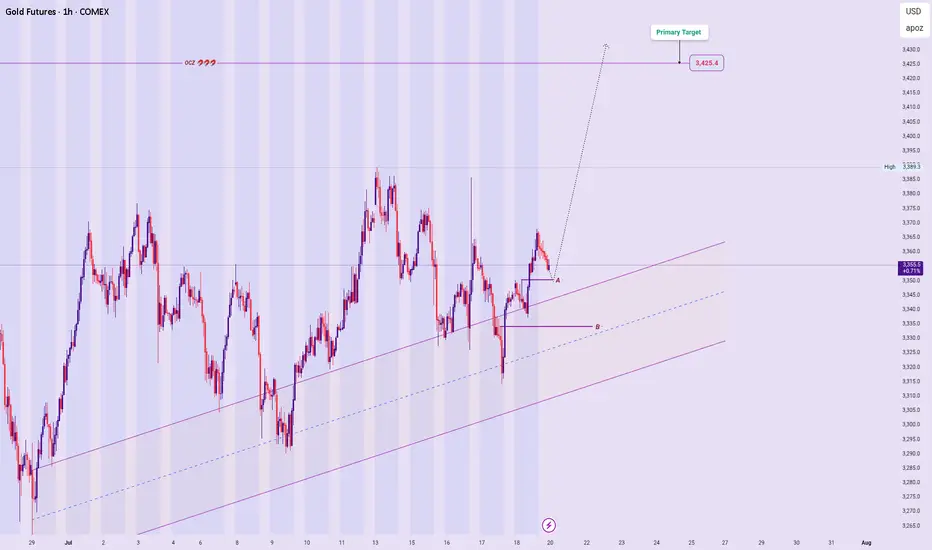
$GC / Gold Update - A New Entry - 7/23Hello fellow degenerates,
Our next target is above 3504 and we are currently in a quick ABC retracement.
- I am looking for an entry in the 3424.6-3411 range.
- This is a wave C so we could see an ABC or a ABCDE pattern forming.
- Levels to watch: 3433.1, 3424.6, 3416.6, 3408

Gold Tests Bullish Zone Near $3,380.0Gold dipped from $3,451.0 and is now testing a bullish FVG near $3,380.0, supported by the 50-period SMA and anchored VWAP.
Immediate resistance sits at $3,389.0. A close and hold above this level may trigger a move back to $3,451.0. Conversely, a break below VWAP could extend the downtrend toward $3,337.0, backed by the ascending trendline.

Gold Bulls Reloading? Smart Money Buys!The technical outlook on XAU/USD shows a well-defined bullish trend, developing within an ascending channel that started in late June. Price recently pushed toward the upper boundary of this channel, reaching a key resistance zone between 3,410 and 3,420 USD, which aligns with a previous supply area and significant daily structure. The reaction in this zone suggests a potential fake breakout, hinting at a short-term pullback before a continuation of the upward move.
The RSI oscillator supports this view, displaying bullish momentum with a breakout above the 60 level. However, the current slope hints at a possible minor correction before the next impulsive leg higher. The most relevant demand zone lies between 3,340 and 3,360 USD, at the base of the ascending channel—an ideal spot for buy orders to accumulate in anticipation of a move toward previous highs.
Backing this technical setup, the Commitment of Traders (COT) report as of July 15, 2025, paints a constructive picture. Non-commercial traders (institutional speculators) increased their long positions by over 8,500 contracts, while also cutting short positions by about 1,600 contracts, indicating a strong bullish bias. Commercials also increased their shorts (+16,448), a typical hedge during rallies, but not enough to invalidate the bullish structure.
From a seasonal perspective, July remains one of the historically strongest months for gold. According to MarketBulls data, over the past 2 years, gold has averaged gains of 105+ points in July, with solid returns also visible on the 5-year (+45 pts) and 10-year (+25 pts) averages. August also tends to be supportive, reinforcing the idea of a medium-term bullish extension.
Lastly, the retail sentiment is heavily skewed, with 72% of retail traders short, and only 28% long. From a contrarian standpoint, this is another strong bullish signal. When the majority of retail traders are short in a structurally bullish market, the potential for a short squeeze remains high.
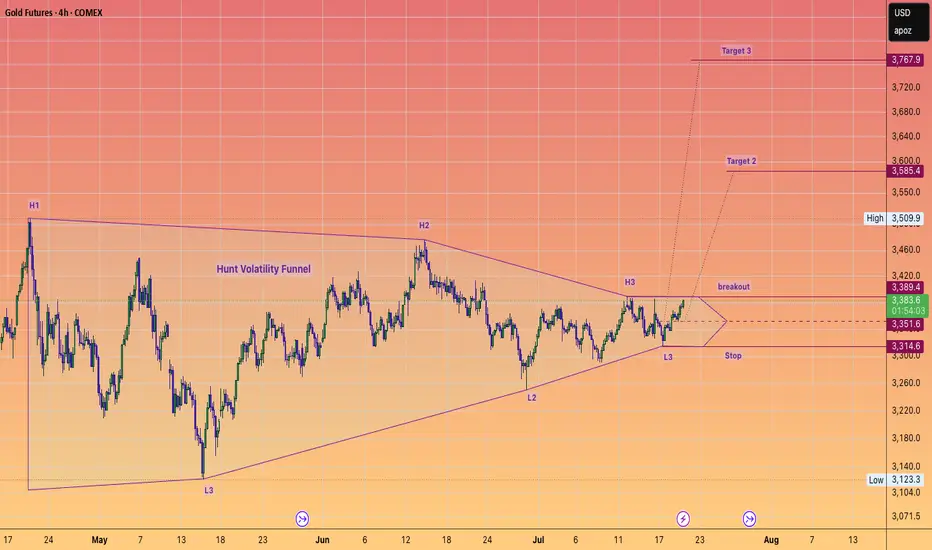
Trade Alert! GOLD to $3800 SOON.#HuntVolatilityFunnel setup which is about to trigger to the upside.
This setup should take gold to or very close to $4K IMHO
#GC
#GOLD
#SILVER
#METALS
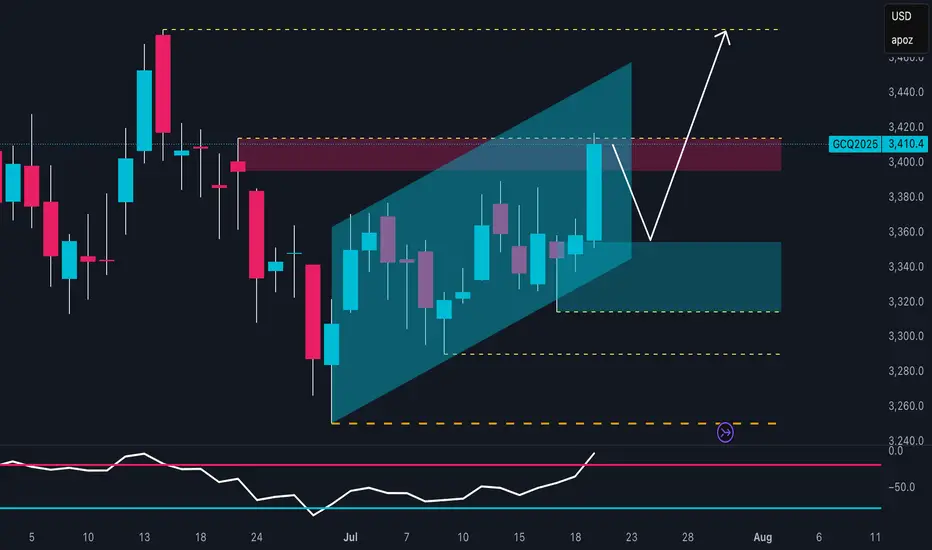
XAUUSD – New Week Technical Bias (Market Open)
Bias Overview:
Current outlook remains aligned with previous bullish analysis, supported by the broader Ascend Sequence on higher timeframes.
Price Expectations:
Anticipating a micro decline toward Price Zone A as a potential springboard for a bullish continuation.
While less likely, a deeper pullback into Price Zone B may occur before the rally unfolds — still within acceptable structure for HTF bullish intent.
Execution:
Will rely on micro-timeframe confirmations and reaction behavior within these zones to finalize entry decisions following market open.
Invalidation will be break and bearish structure below the ascending sequence Channel.
Summary:
Maintaining bullish bias while awaiting refined entry opportunities at defined price zones. Structural invalidation remains below key support and Sequence Line levels.
[b ]🔒 Disclaimer:
This analysis is for educational and strategic insight purposes only. It is not financial advice. Always manage your own risk and confirm with your personal trading plan before executing trades.
Gold [GC1!] 21.07.2024COMEX:GC1!
Daily Orderflow. Asian Range Displacement and London Expansion New York Continuation. Rare expansion day when all three sessions shows one-sidedness

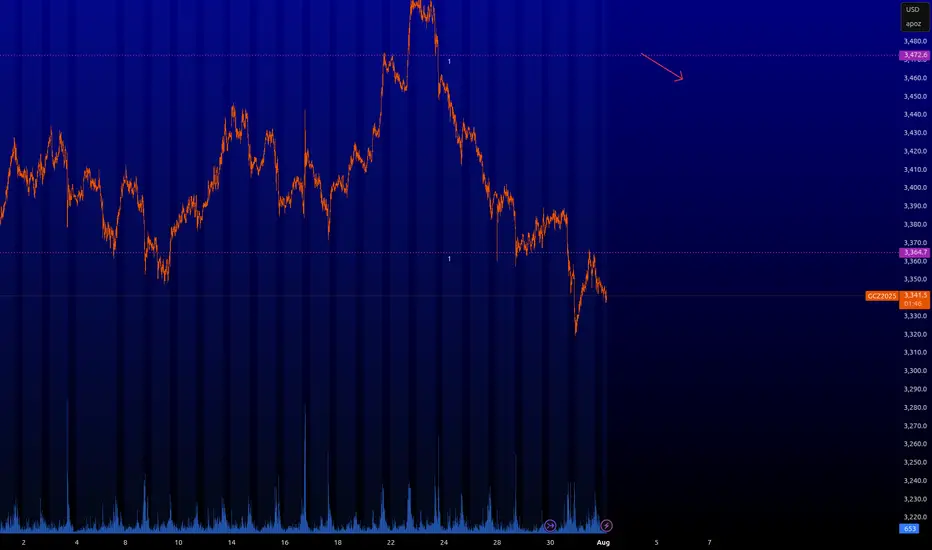
High probability that gold will fallHello,
I hope you're doing well. Here, I'm sharing my analysis of the gold futures market.
Now I see that there's a good chance, about 80%, that it will fall.
Gold will make a Low for the Week before Pushing BullishOn my previous Update I mention that we should have support off this H4 Gap. My problem with it s it immediately reacted to it when the market opened back up. well before the killzone. So I feel like this is a fake out to go short for now. they will make a low for the week then we will see it set up for the bullish move.

GOLD: Pre-market PrepSo for gold today, I see a lot of confluence around the prior week's high, prior day's high, and the prior value area high. We also had a poor high last Friday that we've clearly broken through.
Right now, we're in balance up above these key levels. My immediate plan is to continue going long up to the prior month's value area high. If we get a pullback to the confluence area, I want to take it up from there.
If the market opens and we accept back into the previous area, I'll be looking to go short from that area and take it down. That's my main analysis for gold today. Let’s trade smart, peace!

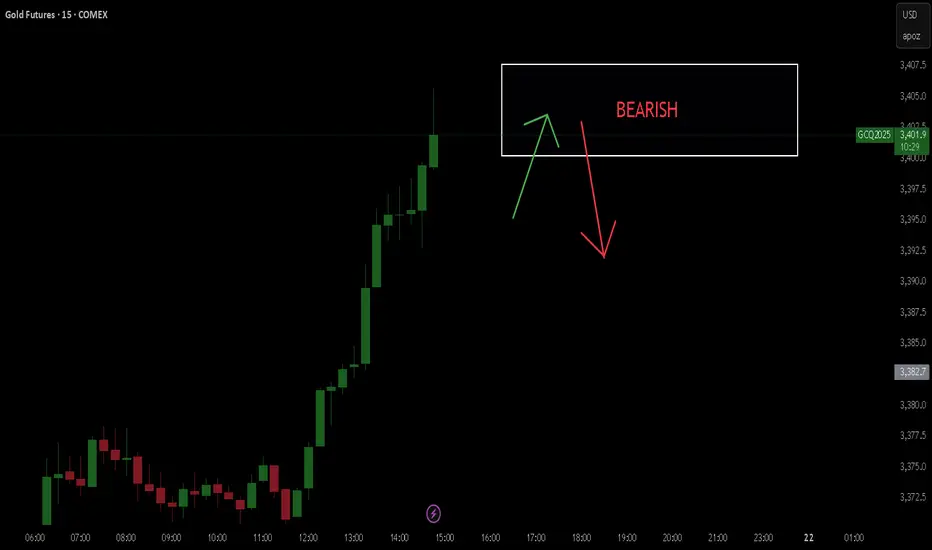
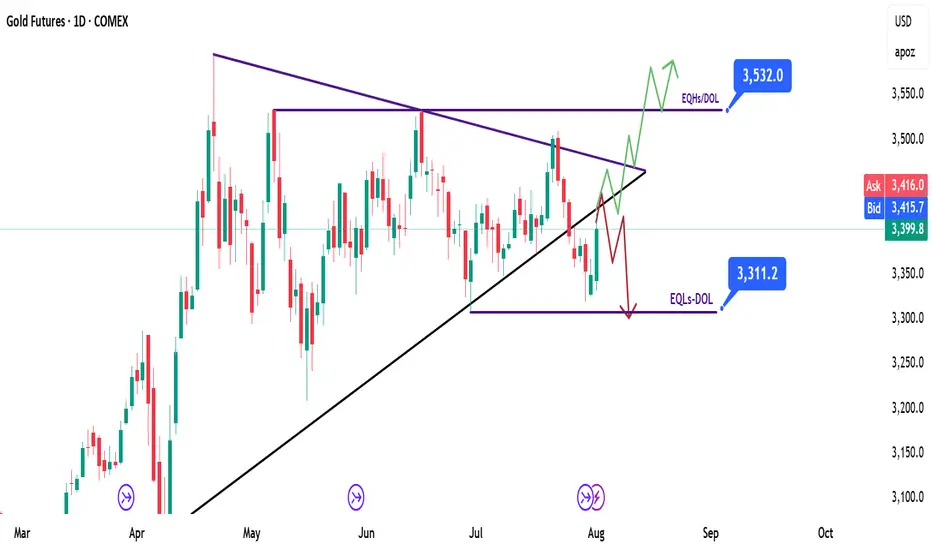
GOLD | XAU/GC - Weekly Recap & Gameplan - 03/08/25📈 Market Context:
Gold is currently trading within an accumulation zone as the market begins to price in a potential 0.25% rate cut by the Fed.
This macro expectation is supporting the broader bullish bias in the commodities market.
🧾 Weekly Recap:
• Price broke below the HTF bullish trendline — a key sign of weakness and potential structural shift.
• However, a sharp drop in the DXY (US Dollar Index) provided a bullish tailwind for gold, resulting in a mid-week bounce.
• This mixed action sets the stage for two potential outcomes next week.
📌 Technical Outlook & Game Plan:
I’m preparing for two possible scenarios:
1️⃣ Bearish Scenario (Red Path):
→ Price retests the broken trendline and rejects it
→ Continuation to the downside
→ Play: Short setup
2️⃣ Bullish Scenario (Green Path):
→ Price reclaims the broken trendline and closes above it
→ Continuation higher toward next resistance
→ Play: Long setup
🎯 Setup Trigger:
I will wait for a clear break of structure (BOS) on the 1H–4H timeframe to confirm directional bias.
📋 Trade Management:
• Stoploss: Below the demand zone (for longs) or above supply (for shorts) on the 1H–4H chart
• Target:
→ Bullish: $3,536
→ Bearish: $3,305
💬 Like, follow, and comment if this breakdown supports your trading! More updates, setups, and educational posts coming soon — stay tuned!
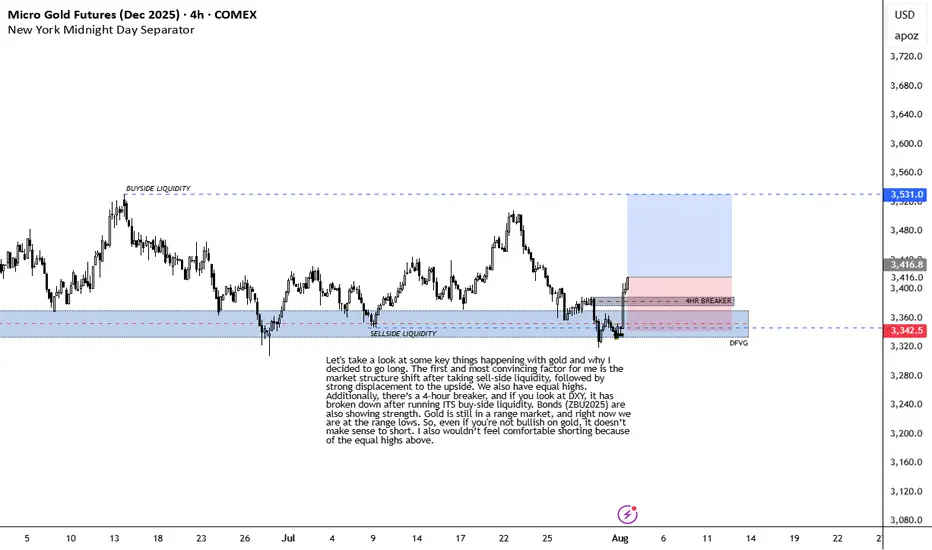
BULLISH ON GOLDLet's take a look at some key things happening with gold and why I decided to go long. The first and most convincing factor for me is the market structure shift after taking sell-side liquidity, followed by strong displacement to the upside. We also have equal highs. Additionally, there’s a 4-hour breaker, and if you look at DXY, it has broken down after running ITS buy-side liquidity. Bonds (ZBU2025) are also showing strength. Gold is still in a range market, and right now we are at the range lows. So, even if you're not bullish on gold, it doesn’t make sense to short. I also wouldn’t feel comfortable shorting because of the equal highs above.
INVALIDATION IS RECENT 4HR LOW.
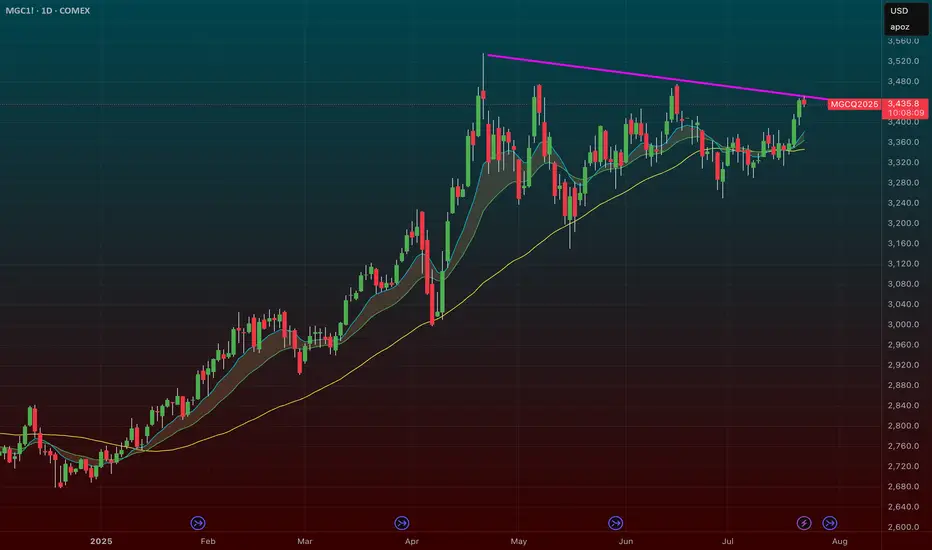
Gold Futures Super Strong Resistance - Price Coming Back StrongGold Future has been very strongly pushing up without filling any gapes in the short side before pushing up more further.
One unique line is probably the target super strong resistance.
In a daily chart, probably better wait until it reaches that point to try to check for strong short entries maybe.
Still arriving there it would explode up even more further to transform that line into a super strong probable support.
Keep watching!
(Do we actually have to believe that gold is secretly targeting $10,000) in the Yearly Chart?... Since February 2022 it just went berserk!)

#GOLD #XAUUSD Seems to have ended the correction FX_IDC:XAUUSD Gold Spot might have completed the correction as a complex 3-3-5 FLAT, and is currently turning higher in wave (ii), however this get invalidated if THE LAST LOW OF 3268.19 BREAKS. Till the pivot 3268.19 stays strong, the move should be impulsive and take us to new high near term.

Gold Range-Bound and Ripe for Mean Reversion Plays?Gold has been locked in a sideways, range-bound regime for months, largely oscillating between the 3400 and 3160 levels. This lack of clear directional trend stems from conflicting fundamental forces: on one hand, sticky inflation and resilient U.S. data have bolstered the U.S. dollar and yields, weighing on gold. On the other, global growth concerns and geopolitical tensions continue to underpin demand for the metal as a safe haven. The push and pull of these opposing themes has created an environment of indecision and choppy price action.
While long-term investors may find this frustrating, range traders and mean reversion strategies are thriving. With technical boundaries so well-defined, short-term oscillations within the range are offering repeated opportunities for disciplined entry and exit.
Currently, XAUUSD is trading just under the 3296 level after a recent rejection from the 3350s. The bearish structure suggests a potential leg down toward the 3160–3180 support zone. However, absent any major economic surprises or geopolitical shocks, this could merely be another deviation from the mean rather than a true breakdown. Indicators like RSI and Stochastic Oscillator are already hinting at early signs of bullish divergence.
If price holds above or near 3160, the setup for another mean-reversion trade back toward the mid-range (around 3296 or higher) could unfold. In the current environment, fading extremes rather than chasing trends remains a strategy of edge, as depicted by the 14 period RSI.
GC : Key levelsHere are the key levels that the market will be interested in. You can scalp from 3.472.
⚠️ VOLATILITY WARNING ⚠️
Trading around major news can be extremely unpredictable. Trade responsibly!
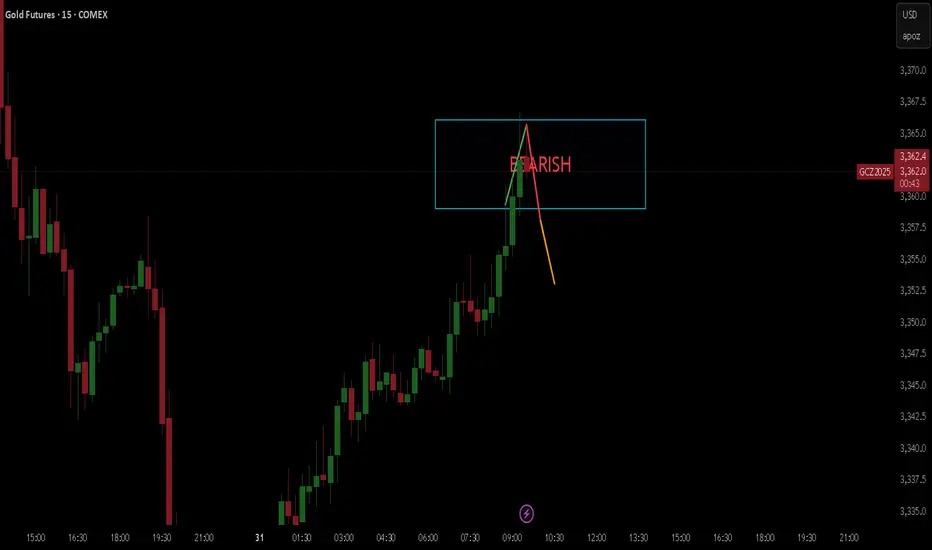
Gold’s Compression Coil Looks Ready to DetonateMGC continues to reject the 50% Fibonacci retracement level from the $3,386.5 swing high, currently trading at $3,347.3. Price has now spent multiple candles trapped under this level, unable to reclaim $3,355, with clear upper wicks and no bullish follow-through.
This is classic midday NY session compression, often setting up a late-day directional move. All signs currently point to continuation lower toward $3,306.2, completing a textbook measured move.
Staakd Probability Model
Based on historical setups where MGC pulls back to 50% and stalls mid-NY:
Scenario Probability
- Continuation down to $3,306.2 68% High-probability path if $3,347 breaks
- Sweep to $3,355–$3,360 before drop. 26%. Possible liquidity grab
- Break and hold above $3,360 6% Invalidation of the short idea
Key Levels
Level
- 100% Fib High $3,386.5 - Swing high
- Supply Zone $3,347–$3,355 - Rejection area + equilibrium zone
- Current Price $3,347.3 - Compression below fib midpoint
- Target Zone $3,306.2 - Measured move / demand structure
- Invalidation $3,360.0+ - Break above this invalidates the short
Trade Idea (Pending Trigger)
- Bias: Bearish
- Entry Zone: $3,345–$3,350
- Target: $3,306.2
- Invalidation: Above $3,360
- Reward-to-Risk: 2.2R–2.5R depending on entry execution
This is shaping into a high-probability continuation setup. NY session has done the heavy lifting: a weak bounce, heavy rejections, and no reclaim of structure. Unless we see a sudden reclaim of $3,355 or a spike in late NY volume, this looks ready to break and expand lower. Keep it simple. Trust the structure. Let price walk itself to the target.

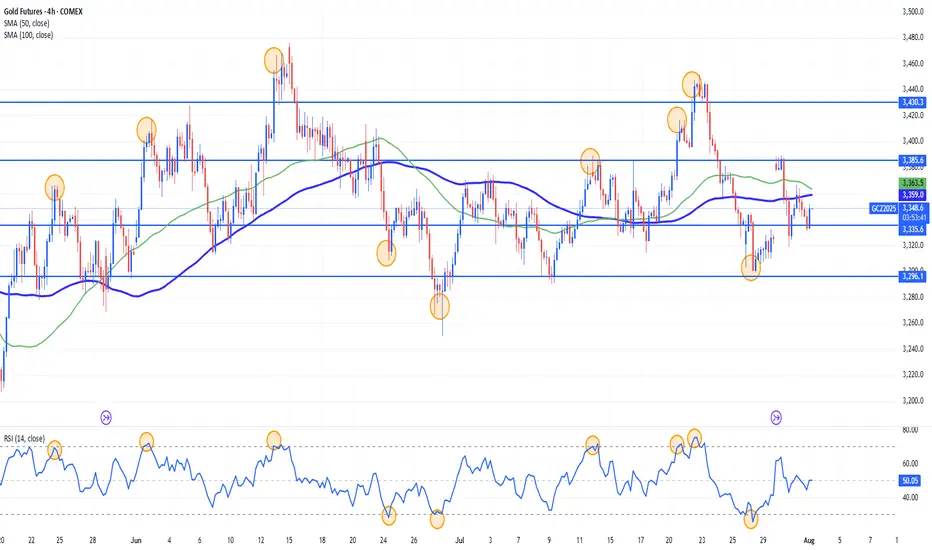
GC AnalysisWith stability signs appearing the gold is loosing its shine. With GC trading in a range.

GOLD BEARISHHello,
I hope you are well.
I have an excellent opportunity for you on gold.
I see a 90% chance that gold will start to fall, so get your strategies and money management ready!