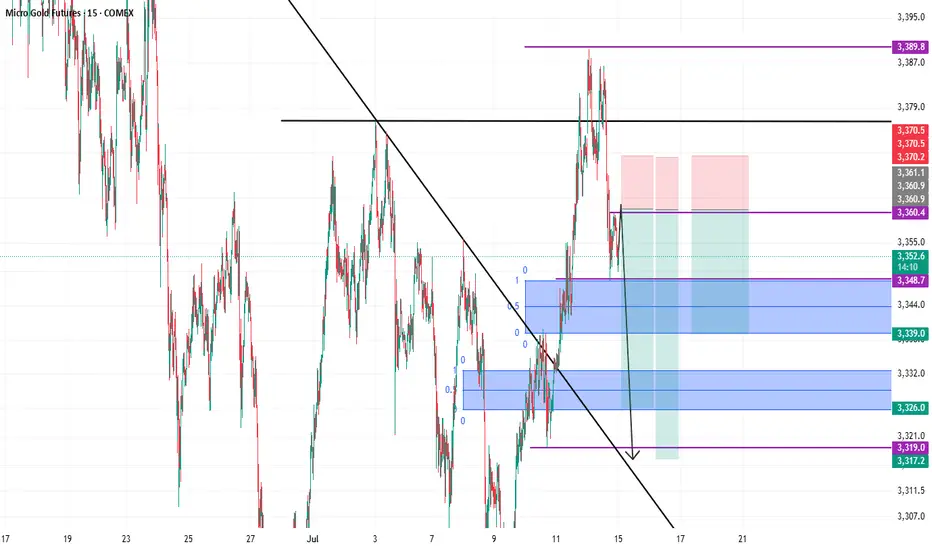
Gold Took the Bait Then Got Body BaggedThis afternoon I stepped outside my usual mechanical system and ran a classic: the Opening Range Breakout (ORB) on MGC just to see if gold still respects the old-school plays.
Marked the range of the first 15-minute candle, waited for the break and confirmation close, then entered on the short side.
Asset: Micro Gold Futures (MGC1!)
Timeframe: 15-Minute
Strategy: Opening Range Breakout
Session: NY
Bias: Short
Trigger: Bearish 15-min close below the ORB low
Notes
ATR Expansion: Signalled volatility coming off the open (range >20 ticks)
Liquidity Trap: Gold swept ORB highs before dumping a classic trap-and-flush
Volume Confirmation: Delta turned aggressively negative at the break
Risk-Reward: Tight stop above range, clean 1:3 move into session lows
ORB: Dumb-Simple, Still Deadly
ORB is one of the simplest tools in a trader's playbook and that’s what makes it dangerous (in both directions). When it works, it works. You define the opening range, wait for price to break out and confirm, and ride the move.
But here’s the nuance:
Gold LOVES to fake one side before exploding the other. It’ll sweep liquidity, bait breakout traders, then detonate in the opposite direction. Today was a textbook clean sweep of ORB highs, then a brutal reversal and breakdown.
I usually lean on mechanical, model-based strategies, structured entries, rule-based exits, logic-driven setups. But I’m not blind to price. Having a few flexible strategies like ORB in the toolkit gives you options on days where market intent is obvious. So… does ORB actually work? Here's what the research says:
- Al Brooks (Price Action Trading)
ORB-type plays win 55–60% of the time when confirmed with price action and managed properly.
- Linda Raschke (Street Smarts)
ORB entries rated highly during volatility expansions especially in futures.
- Quantified Strategies (S&P 500 ORB backtest)/b]
57% win rate with basic 1:1 R:R and no filters.
Internal Bookmap/Tradovate tracking on MGC .
Fake outs occur in 30–40% of ORB plays, especially during thin liquidity or low-news days. But let’s be real that 55–60% win rate is open to interpretation. It depends on the confluences. Are you using delta confirmation?
Are you filtering by session or volatility? Are you waiting for a close outside the range or just guessing? ORB works if you work it. The strategy isn’t magic. The execution is.
The twist with today wasn't a "trend continuation" move. It was a rejection. Gold baited breakout longs, then pulled the rug. This is where mechanical structure meets tape intuition.
Retail chased. Price snapped. Quant stayed calm and shorted the flush.
What Do You Think?
Do you still trust ORB? Or is it a trap most days? Do your stats back it up or have you evolved beyond it? Let’s open it up. Drop your ORB rules, tweaks, or horror stories below. I’ll reply to every serious one.
Gold Guinea Futures
GOLDGUINEA1! trade ideas

XAUUSD, GOLDBullish view on GOLD for New York session, Daily FVG, if price taps in will look for confirmations to go long

Shorting Gold again and againYep, Iam still thinking that gold should be shorted. Even though that i can see there is some huge liquidity up which should draw the money to it, but still on bigger timeframes, it shows weakness.
So here it is with targets. hopefully it goes through.
Good luck everyone.
The Gold Retrace for Ultimate Entry!looking for price to continue with its pullback to find where exactly support is. Once we see price establish support we should get some type of signal for entry and price can continue with this bullish price action to make new highs. If we get a full 71.8% pullback that should make for a nice bull run. Just need to wait for the confirmations first before reacting cause we might get a lot of chop until then.

Gold and DXY. Day before CPI 14.07.2025, MondayExplaining about the thoughts on CPI. Expect major movements on GOLD

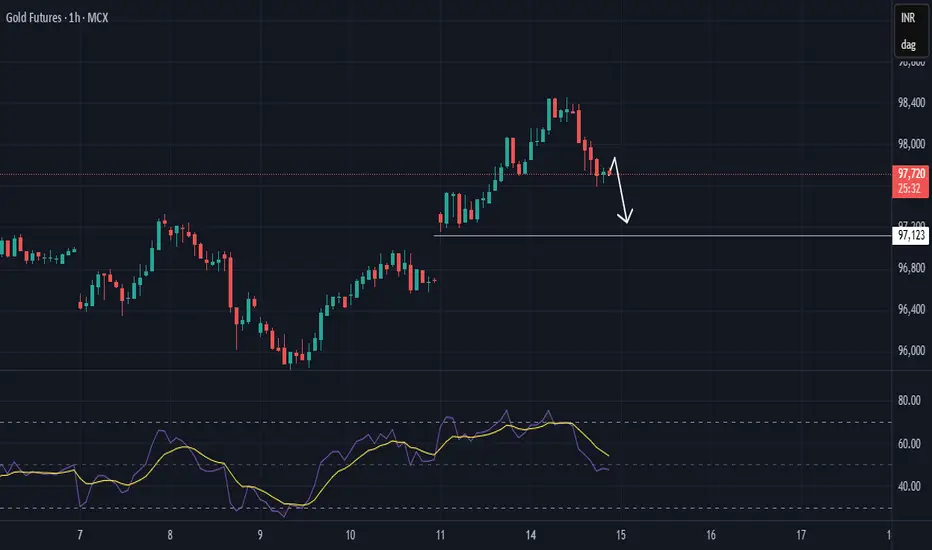
Proposed Next move in gold hourly basisProposed Next move in gold hourly basis, this study is published for educational purpose and not at all a trading suggestion.
This is a good video7.14 . 25 this is a great video because there are so many examples of patterns to look at and there weren't that many markets that I was following and about 3 or 4 of the markets actually had dramatic movement in the direction you would expect and this is an example of setting up your pattern and letting the pattern take care of you as it gives you the probable Direction the market would take and there would have been no significant drawdowns or retest associated with stops... As was seeing in the coffee Market.

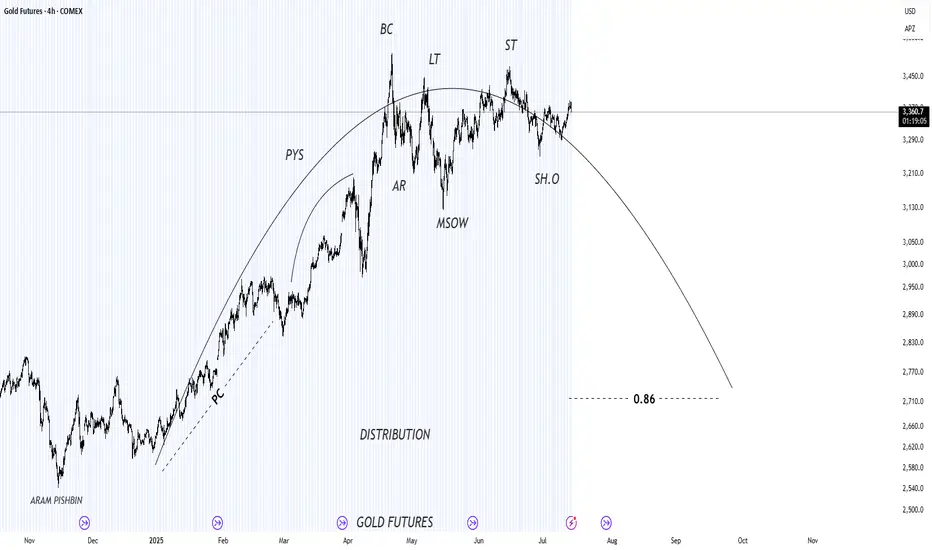
xauusdtCOINBASE:GOLQ2025
Gold analysis on the 4-hour time frame in the Wyckoff style, which is in a changing trend, thanks to the esteemed professor, Mr. Ramtia Siddiqui
$GC / Gold - Weekend Update - 7/14Hello fellow gamblers,
We got both scenarios still active on gold, and I am bringing an update on both of them. It is a longer video, but hopefully the information can help you out on your trades.
- I want price to stay above 3363 for a bullish continuation.
- A strong rejection or loss of 3342.8 could initiate a bearish move that will validate our bearish scenario.
- Level to watch: 3418, 3363, 3283

head and shoulders forming?COMEX_MINI:MGC1!
A head and shoulders pattern appears to be forming.
i am looking to swing what could be a right side shoulder.
New Week on Gold! Will the Bullishness continue?I was bullish on gold and price ended up doing as expected last week and looking for it to continue this week. But i have to sit on hands for now to see how they want to play Monday. Will they move to create a Low for the week first? or will they break out to start early on new highs? I have to see some type of confirmation first. Then we can get active.

Shoring GoldSo here we go again with gold.
there are two theories at this point, a bullish case and a bearish case.
The bullish case that the price broke a bearish trend and moving upwards.
For a bearish case, the price didn't close that strong above the last swing. Also the whole structure is bearish so this last up move could be very well a trap for buyers.
On the 4h tf, there is an FVG, bearish one that the price so far is reacting to.
So Even though there is a strong up move, i still lean bearish.
Later today once i get a confirmation, i will update the idea.
I might be very wrong on this trade, my confidence in this trade is 4 out of 10. So Use smaller size position.
Also iam expecting the price to revisit 3320 USD

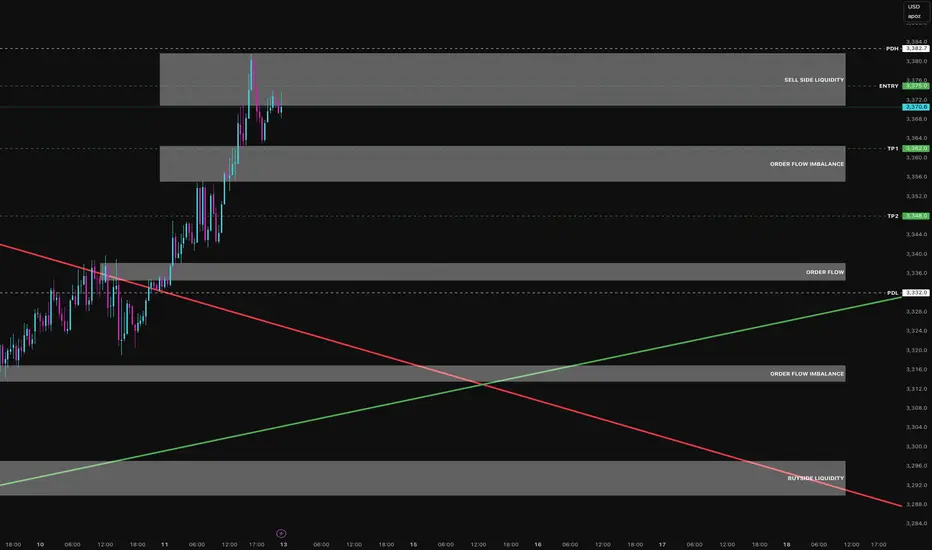
Gold’s Got Commitment Issues, Short the GhostingWe’ve reached a premium zone, tagged prior Buy-to-Sell Liquidity (BTL) above 3,778, and filled a local imbalance. With structure breaking above the previous bearish trend line but reacting to a liquidity zone, we are anticipating a rejection and retracement during the Tokyo and London sessions before NY opens.
Thesis: Trendline Structure
Clean break above the bearish structure; price is testing the zone where buyers may exhaust.
Rejected cleanly from the Sell-Side Liquidity box between 3,775–3,780, suggesting seller presence.
Key Imbalances
Major Order Flow Imbalance at 3,760 already tapped and showing reaction. Further downside liquidity targets resting in imbalance zones 3,715 and 3,685, offering high RR plays.
Market Context
Price flipped bullish into NY last week but overextended into a thin volume zone. This leaves us with a high probability of a retrace to retest deeper imbalances and prior demand structure.
Macro levels like PDH (3,782) and PDL (3,322) give us range clarity. Now let's get into the execution.
Execution Plan
Entry Zone - 3,775.50–3,780.00 (confirmed reaction)
TP1 - 3,760 (imbalance fill)
TP2 - 3,743 (prior OF zone)
SL - Above 3,783
Trade Logic - Enter short post-Tokyo if price retests 3,775–3,780 with rejection candle on LTF (5–15min). Confirm with volume divergence or weak delta.
Risk Context
Avoid chasing price, NY open tends to offer better fills. Watch the 3,743–3,715 zone. Strong demand may react here into NY. If price reclaims 3,783, invalidate short bias and reassess.
Notes
Liquidity Grab has already occurred on the upside. Watch for Order Flow Absorption between 3,760–3,765. Tokyo volume is often deceptive do not overcommit early. Look for a full 1:3 setup and scale partials at TP1.
If you followed this plan, how did your entry go? Did your execution align with the bias? Drop your screenshots, tag me, or reply with your play-by-play always keen to sharpen my edge.
GOLD - GC | Weekly Recap & Plan 13.07.2025🟡 GOLD (GC) Weekly Recap & Outlook
Symbol: GC1!
Date: Week of July 8–12, 2025
Timeframes Used: 4H, Daily, Weekly, HTF structure
🔍 What Happened Last Week?
Gold saw a strong rejection from a confluence of two HTF trendlines, signaling resistance.
But that move was absorbed by:
🟦 Daily Demand (blue zone)
🔵 Daily Swing Liquidity (blue line)
This builds a bullish structure on the daily chart.
🧭 Scenarios I'm Watching
Scenario 1 — Minor Pullback:
🔹 Price may revisit the Daily Gap (pink line) and find support for continuation.
Scenario 2 — Deeper Pullback:
🟣 Price could retrace into the HTF bullish trendline (purple) before resuming upside.
🗞️ Bonus Macro Scenario: Powell Resignation?
There are growing rumors that Fed Chair Powell might resign this week.
📈 If that happens, I expect strong bullish momentum in Gold —
→ very limited retracement, and
→ potential straight breakout into new highs.
🎯 Targets for the Week:
✅ 1st Target:
W C DOL (purple line) → acts as a primary take profit area.
✅ 2nd Target (Expansion):
EQHs / DOL (extended purple levels)
Game Plan:
Watch for LTF confirmation on both retracement zones.
Maintain bullish bias unless Daily Demand fails.
If Powell resigns, be ready for breakout setups.

GOLD TRADING IDEA FOR 14-18 JULY 2025The price of Gold currently at the H4 liquidity control area at 3376. It's seem like there candlestick H4 rejection at that area but still not valid for market structure shift direction.
If the candlestick breakout above at H4 liquidity control ,I will looking opportunity for long position with target at next H4 liquidity control at 3390 or extension target at 3410.
short term SELL
Price retracement before the price going up.
If small timeframe show market structure shift or develop bearish engulfing pattern at H1 0r m30 below 3376 . The target will be h4 liquidity control at 3354 or 3320 depend on how price act at that area.


Performance Audit GC Precision Week (W/E July 11, 2025)This week’s operations focused solely on GC (Gold Futures) with a disciplined structure-first model. Only five trades were executed — all pre-validated, rule-based, and logged. The result: +6.8% portfolio gain, a controlled 1R max risk profile, and no strategy deviation.
No forecasts. No overtrading. Only defined setups and asymmetric execution.
Staakd isn’t about high-frequency noise it’s about data-driven decisions, edge alignment, and position sizing that compounds over time.
Weekly Summary
Trades Taken 5
Wins 4
Losses 1
Win Rate 80%
Avg R/R Ratio 2.1:1
Net R Gained +6.4R
Portfolio Growth +6.8%
Max Drawdown (in-session). < 1R
Strategy Deviation 0%
Overtrading Incidents 0
Context:
Most professional day traders target 1–3% per week. Prop firms often expect 8–10% per month. A +6.8% weekly gain, on just 5 trades with strict risk control, reflects not just profitability — but edge, structure, and execution precision.
Systems Deployed
ORB Breakout Model — NY Open-based volatility extension
Pre-Market Liquidity Sweep Model — Asia Close setups
Supply/Demand with Imbalance Filtering
Session Volatility Overlay — Trade windows confined to high-probability timeframes
All positions were triggered only after full multi-signal confirmation:
▫️ HTF structure validation
▫️ Liquidity mapping
▫️ FVG/inefficiency alignment
▫️ Volume + time-of-day confluence
No trades taken outside predefined protocols. No scalping. No overrides.
Trade Validity Scoring
Entry Logic Precision 91.6%
Setup Integrity 100%
SL Discipline 100%
Journal Compliance 100%
Emotional Bias Detected 0%
The one loss was structurally valid, aligned with bias, and managed with precision. Losses don’t damage equity emotional errors do. None occurred.
Next Week Model Update
Asset Focus: GC (Gold Futures) remains primary
Schedule: Monday–Thursday only (Friday excluded for edge decay)
Sessions: NY Open and Asia Close exclusively
Setup Preference: Structure > Imbalance > Sweep
Trade Limit: 1 per session max
Bias: Continue compounding gains through mechanical execution
Why Follow Staakd?
If you’re tracking setups like a quant not a gambler and you value transparency, discipline, and systems over hype: @stakkd on TradingView Every move is structured. Every result is tracked. No guesswork. Just edge.
Gold. The plan for the next few days.The nearest resistance zones are where it's interesting to look for purchases. We are waiting for a reaction and looking for an entry point.
The post will be adjusted if there are any changes.
Don't forget to click on the Rocket! =)

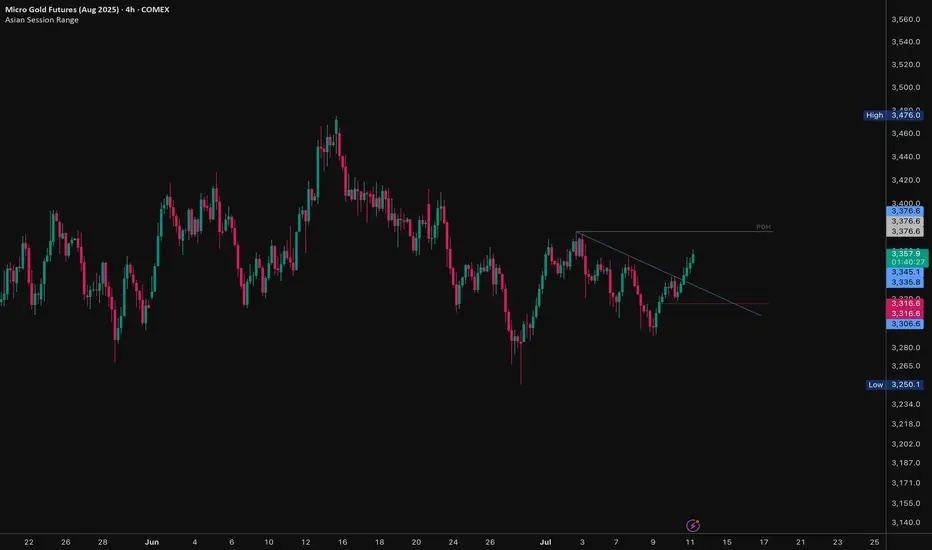
Gold - Watching for Trendline Retest Gold has shown a significant breakout from a recent downtrend resistance line on the 4-hour chart. The price action suggests a shift in momentum, but a potential retest of the broken trendline offers a high-probability entry point.
Technical Analysis:
Trendline Breakout Confirmed: The provided chart clearly shows XAUUSD breaking above a descending trendline that has defined the recent short-term consolidation/downtrend. This breakout indicates a potential resumption of bullish momentum or the end of the consolidation phase.
Immediate Resistance: The price has encountered resistance near the area of the previous daily high (PDH) or a local swing high around 3,376.6. This level will be the immediate target for buyers if the breakout holds.
Potential Retest Zone: A common occurrence after a trendline breakout is a "retest" of the broken resistance level, which now acts as support. The trendline itself and the immediate support levels identified on the chart (e.g., 3,335.8 to 3,316.6) form a potential retest zone.
Trade Idea & Strategy:
The primary trade idea is to wait for a technical confirmation of the breakout by observing a retest of the broken trendline.
Entry Strategy (Bullish Confirmation):
Wait for the price to pull back towards the broken trendline (approximately 3,330 to 3,345 area, depending on the exact slope).
Look for bullish reversal signals (e.g., candlestick patterns like hammers, engulfing patterns, or significant buying volume) at the trendline support.
Enter a long position upon confirmation of support at the retest zone.
Potential Target 1: The recent swing high/PDH area around 3,376.6.
Potential Target 2: If Target 1 is cleared, the high of 3,476.0 (or previous major resistance levels).
Stop Loss: Place a stop loss below the low of the retest candle or below the significant support area (e.g., below 3,300), invalidating the bullish setup.
Alternative Scenario (Bearish Rejection):
If the price fails to hold the trendline support during the retest and decisively breaks back below it, the breakout may be considered a false breakout. In this scenario, the market could revert to the previous downtrend structure.
Disclaimer: This is an analysis for educational purposes and is not financial advice. Always perform your own research and risk analysis before trading.
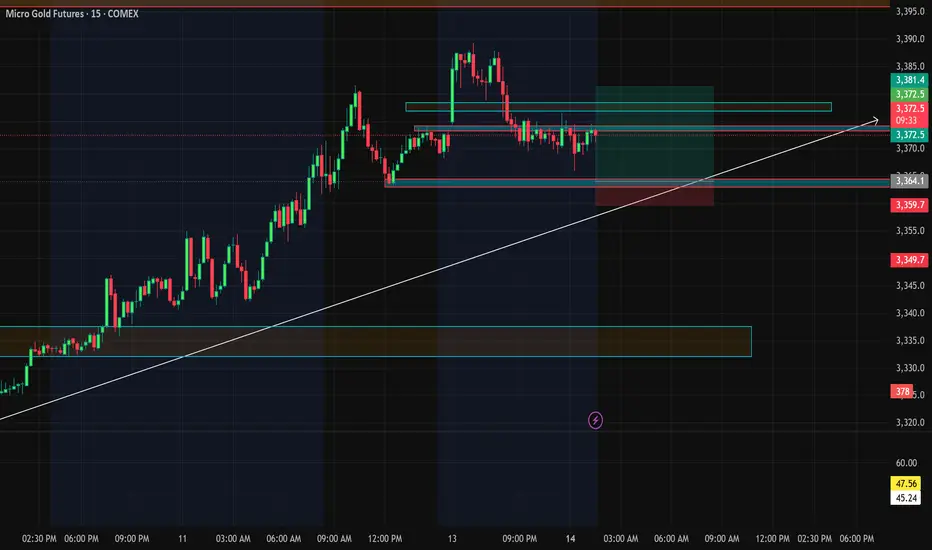
NY Open PlaybookGold is extended heading into NY, but structure is clean and bullish. We’re sitting above PDH and holding a reclaimed supply zone. If $3,364 holds, we expect continuation toward $3,384–$3,390. If NY rejects at the top, watch for a clean reversion to $3,346 and possibly lower. Key decision level is $3,364.
Key Levels
PDH - $3,359
Previous day high (currently holding above)
PDL - $3,310
Previous day low
Displaced HVRA - $3,346 – $3,350
Reclaimed supply → demand (buy zone)
FR Demand Block - $3,324 – $3,335
Fair range support if trend fails
Primary HVRA - $3,372 – $3,384
Main target / short trigger zone
ATE Extension - $3,390+
Final bullish extension target
Bullish Scenarios
(b]Reactive Long
Entry: $3,346 – $3,350
SL: $3,343 (aggressive) or $3,339 (safe)
TP1: $3,364
TP2: $3,372
TP3: $3,384
Momentum Breakout Long
Trigger: Break + hold above $3,364
SL: $3,358
TP1: $3,372
TP2: $3,384
TP3: $3,390+
Bearish Scenario
Rejection Short
Entry: $3,372 – $3,384 (on wick/failure)
SL: $3,390
TP1: $3,358
TP2: $3,346
TP3: $3,335
Direction is binary at $3,364. Whether we rotate down or extend up, both plays are valid execute with discipline, not bias.

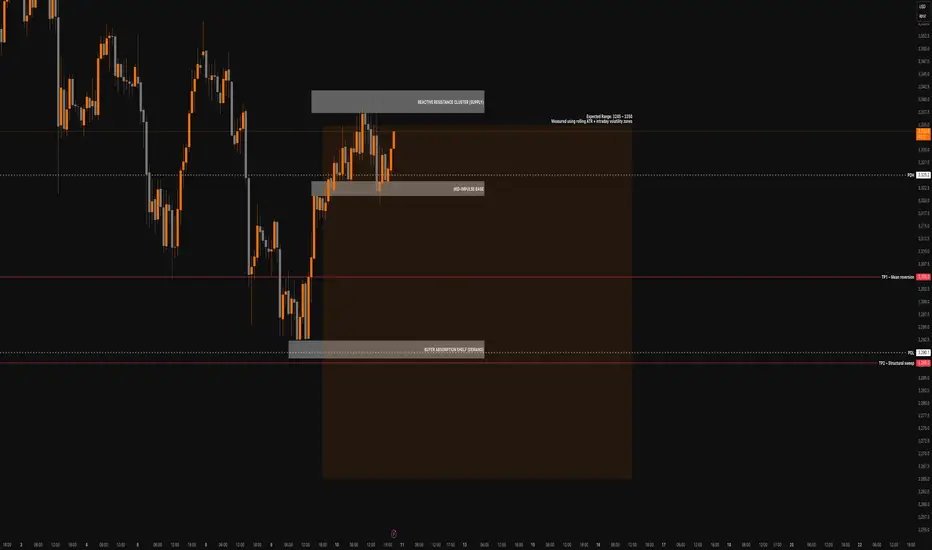
Gold Futures Short Bias Into NY CloseGC is stalling beneath the 3330–3336 resistance cluster after failing to break out during NY session. Price rejected the fair value gap (3312–3318) and is now compressing just above the mean-reversion anchor (LWN). There’s no momentum reclaim from buyers, and structure suggests weakness into Friday.
We’re positioning short into expected downside continuation.
Key Levels
Reactive Resistance Cluster: 3330–3336
FVG (rejected): 3312–3318
Mean-Reversion Anchor (LWN): 3290–3300
Absorption Shelf (Target Zone): 3275
PDH/PDL (provisional): 3325 / 3280
VWAP: Flattened, near 3302
Short Setup (Active)
Entry: 3332
Stop: 3340
TP1: 3305 – Mean reversion
TP2: 3288 – LWN sweep
TP3: 3275 – Absorption shelf
Staakd Setup: 1:5.7 R:R to final target
Bias confirmed by rejection from inefficiency and absence of buyer follow-through
QM Probabilities
Bear Move 60–65% Structure favoUrs continued rejection + flush to 3275
Bull Move 35–40% Requires reclaim of 3318 + aggressive close above VWAP
Range/Flat Possible pre-close Tight range unless displaced overnight
Staakd Bias:
Structure is holding beneath resistance. Without a reclaim of 3318, we remain short-biased into Friday with eyes on 3275. Probability favours continuation unless buyers reclaim initiative fast.
Follow for post-close recap and updated levels ahead of Friday's NY open and we hope your trades worked out how you expected today.
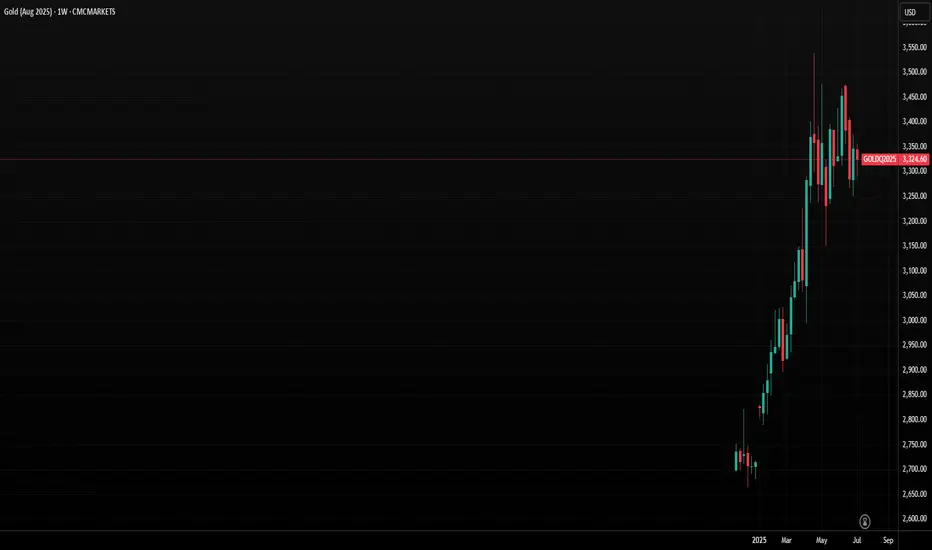
Gold at Critical Juncture as Bearish Momentum GrowsGold is showing signs of breaking down as the US dollar recovers from a steep decline. Gold and the dollar typically have an inverse relationship over the longer term. The precious metal has been trading sideways since April, but more importantly, it has been trending lower since mid-June. Gold is now approaching a critical juncture, testing an uptrend established in mid-May. Although it has previously held this support level, gold appears likely to break lower this time.
The Trend Lower Is Strengthening
The Relative Strength Index (RSI) is now trending steadily lower, forming a series of lower highs. This suggests that gold’s momentum is currently bearish, indicating potential for continued weakness in the days ahead. To reverse this bearish momentum and shift to a bullish outlook, the RSI would need to rise firmly above 50.
More significantly, gold is now very close to breaking a significant uptrend at $3,300, which was previously tested on June 27 and June 30. On both occasions, the price dipped intraday below this trendline but managed to close above it. The trendline was retested on 8 July, initially holding, but gold is dipping below this critical support level again on 9 July. A close below the trendline on July 9, followed by continued declines starting on July 10, would confirm that the uptrend has broken. This breakdown would signal further downside risk, with initial support at $3,230, followed by $3,170.
Triple Top
Perhaps even more crucially, a triple-top pattern established at the $3,400 becomes increasingly likely each time gold trends lower. The $3,170 support level is particularly significant because it forms the neckline of this triple-top pattern. A decisive break below $3,170 would confirm the triple top pattern and indicate a deeper decline, potentially targeting the range between $2,950 and $3,000.
Written by Michael J. Kramer, founder of Mott Capital Management.
Disclaimer: CMC Markets is an execution-only service provider. The material (whether or not it states any opinions) is for general information purposes only and does not take into account your personal circumstances or objectives. Nothing in this material is (or should be considered to be) financial, investment or other advice on which reliance should be placed.
No opinion given in the material constitutes a recommendation by CMC Markets or the author that any particular investment, security, transaction, or investment strategy is suitable for any specific person. The material has not been prepared in accordance with legal requirements designed to promote the independence of investment research. Although we are not specifically prevented from dealing before providing this material, we do not seek to take advantage of the material prior to its dissemination.
Bearish Rejection from SupplyDuring the NY session open, Gold (GC1!) broke above the 30-min ORB high at 3335.8, briefly entering a known supply zone (3342–3345). The move lacked follow-through and immediately reversed — signalling a liquidity sweep and classic NY session trap setup.
This invalidates the bullish breakout and supports a short-biased play back toward the ORB low and into deeper demand.
Trade Details:
Entry: 3336.0 (short after failed breakout + rejection candle)
Stop Loss: 3342.0 (above the supply zone high)
Take Profit 1: 3327.1 (ORB low)
Take Profit 2: 3320.0 (prior demand zone)
Take Profit 3 (optional): 3315.0 (liquidity void fill)
Risk:Reward: ~1:1.3 to TP1, ~1:2.2 to TP2
Position Type: Short
Execution Time Frame: 5-min/15-min
Model Tags: Liquidity Sweep, NY Session Fade, Supply Rejection
🔍 Quant Notes:
Price action exhibited a false breakout — NY session opened with an expansion move above ORB high, which was immediately rejected.
Re-entry into the ORB range confirms buyer exhaustion and makes a move back to the ORB low highly probable.
Bearish bias is reinforced by multiple upper wicks, supply zone rejection, and failed structure reclaim.
Key Confirmation:
Bearish engulfing or strong close back below 3335
Failure to reclaim EMAs or trend line
Momentum shift on 5-min with volume divergence
Closing Thoughts:
A failed ORB breakout into supply during NY open is a classic trap — and today’s price action on GC1! fits the model. This short setup targets the full ORB range retrace with potential continuation if sellers hold control.
