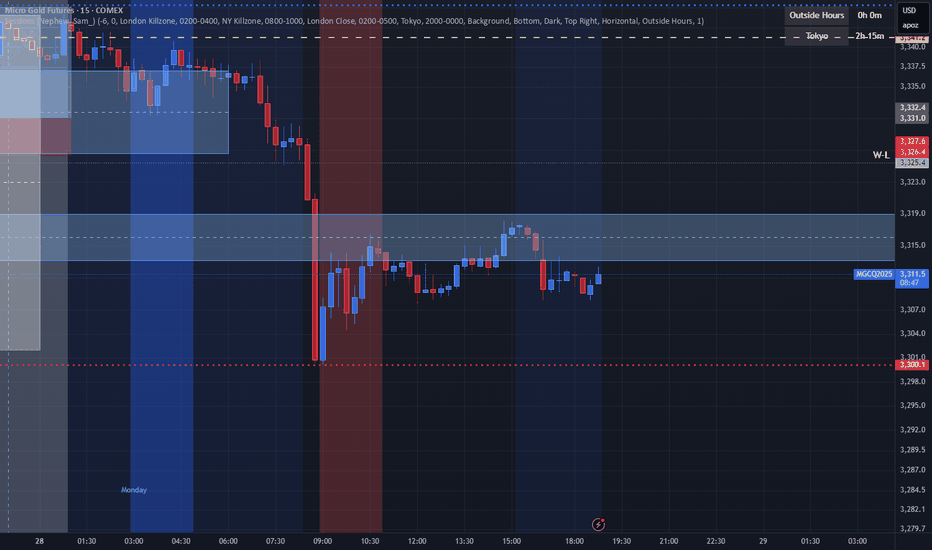
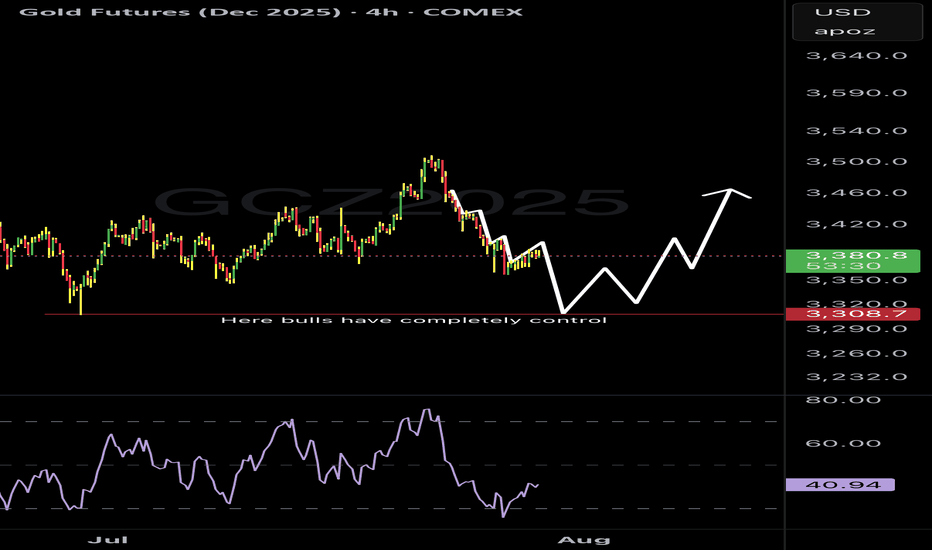
Gold 2025What does Gold have in store for us, i still believe we get a deeper correction before we continue the rally higher. The way I see the market playing out is indicated. I do think that $3000 will be a reasonable target before we probably revert to a range of $2000/$3000by MarkLangley1
Gold - The Next Bitcoin?The markets are beyond stretched—they’re squeezed all the way to the moon. Today, I heard some major news: Big Money has already left the party, and others are following suit. This is HUGE. It’s also that classic moment when the barber starts sharing his “secret” stock tips. Now, if you pair this with my recent Bitcoin post—where I outlined how a tulip-like crash could unfold—you’ll see we’re staring at the perfect recipe for a stock market KABOOM. So, where will traders, investors, and even grandmas rush to when this unwinds? My bet: Gold. Where else? This is when the Gold Rocket ignites, replacing Bitcoin and the MAG7, creating yet another bubble—a glittering tulip 5.0. And just like before, it’ll burst when the fuel runs out. Buckle up! 🚀Longby Tr8dingN3rd1
Gold Positioned for Further Gains Amidst Economic UncertaintyRecent Performance: Gold has seen substantial fluctuations in recent months, reaching record highs while also facing notable resistances. With a year-to- date appreciation exceeding 30%, gold has outperformed other major asset classes, benefitting from a flight to safety as inflation rates continue to rise and geopolitical tensions create uncertainty. - Key Insights: Investors should maintain a close watch on gold as it reveals robust demand against a backdrop of inflation and currency devaluation. The support levels between 2400 and 2500 provide a buffer against potential downturns, while the bullish sentiment surrounding central bank activity underlines gold's status as a critical component of investment strategies. - Expert Analysis: Market sentiment remains cautiously optimistic, with analysts divided. Bullish views on gold stand strong, yet some concern exists regarding possible bearish trends in silver. Experts from firms such as Goldman Sachs warn of high price multiples in the equity markets, cautioning investors of a potential downturn while underscoring gold's attractiveness amid economic fluctuations and interest rate discussions. - Price Targets: Based on professional trading insights, the following targets and stop levels are set for the coming week: - Next week targets: T1 is 2750, T2 is 2835 - Stop levels: S1 is 2600, S2 is 2550 - News Impact: Recent inflation trends have introduced short-term volatility in gold prices, yet central bank strategies continue to support a bullish outlook for gold in the long term. The anticipation of interest rate cuts will be pivotal, increasing gold's allure in investment portfolios, particularly as it maintains strength against currency fluctuations and challenges in other asset classes.Longby CrowdWisdomTrading0
GC (GOLD) Looking bullish for the new week. Looking for Bullish play action on GOLD for the week. Last gave a healthy pullback into the current value area on a larger scale but looking for a return to value on a smaller scale that can lead to much bigger breakout. Long01:08by DWoodz0
#202450 - priceactiontds - weekly update - goldGood Evening and I hope you are well. tl;dr gold futures: Neutral. Very strong rally Mo-Wednesday just to almost completely reverse and close the week 11 points above the open. Rallies getting stuffed hard now and bulls will only try so many times until we test lower prices. 2630 is the price for bears to break and bulls need anything above 2760 again. It’s much more likely that we close 2024 around 2700. Market has also formed another triangle on the daily/weekly chart, so don’t expect a trending market for the next 3 weeks. Quote from last week: comment : I won’t waste much time with this market this week. Clear triangle and market is in total balance around 2660. Wait for the breakout or play the range. My best guess would be that we both see 2600 and 2700 in the next 3 weeks. comment : Quick and dirty again. Bulls had the perfect setup for 2800+ but blew it. Big bois selling the rips and market formed another triangle. I doubt it will go anywhere in the next 3 weeks. Likely yearly close around 2700. Play the range or don’t trade this at all. current market cycle: trading range key levels: 2620 - 2750 bull case: Bulls blew it. The setup from last weeks Friday was perfect and Mo-We we had amazing follow through. Thursday was a huge bear surprise and bulls just gave up on the rally. They got stuffed big time now two times over the past 5 weeks, which makes me believe that there are probably not many more bulls who want to try a third time. Sideways is the most likely and reasonable thing to expect here. Invalidation is below 2630. bear case: Strong bears selling the rips but I don’t expect them to really try and push this below 2600 again. 2630 was huge support the past weeks and even if they print below, they would still have to break through the big bull trend line from August. Invalidation is above 2763. outlook last week: short term: Neutral inside given range. → Last Sunday we traded 2659 and now we are at 2675. Market went much higher than expected but nowhere on the week, so outlook was ok. short term: Neutral inside given range. medium-long term - Update from 2024-12-07 : No bigger opinion on this for the rest of 2024. Market is in balance until we see a new impulse. Likely close around 2700. current swing trade: None chart update: Nothing by priceactiontds0
The 3 Step Rocket Booster Strategy From The Iron WatchlistIn life you really have to be careful with you communicate in order to draw your point across because not everyone will understand your vision, In this video, I share with you 2 assets that are part of the Top13 Iron Watchlist That are in a position for a great buy Also, I will show you the 3-Step Rocket Booster Strategy To learn more watch this video. Disclaimer: Trading is risky please learn risk management and profit-taking strategies. Also use a simulation trading account before you trade with real moneyLong04:26by lubosi1
End of the 1 year Gold Run ?Are we looking at the end of the 1 year gold run that started in October 2023 at around 1600 all the way to 2800. Are are seeing the top of the structure - and RSI weaknesses. It is my strong belief that Gold already saw its peak on the week of October 28th 2024. It has ample room to correct. A 32.5 correction should take it to the 2300 levels. A 50% move correction, which is an indication of a deeper correction should take it to 2200 levels. Shortby caljosh10
This is Wyckoff VSA Pro V1 with a short set up based on VolumeIn this short video, Author of "Trading in the Shadow of the Smart Money", Gavin Holmes, demonstrates the new Wyckoff VSA Pro V1 for TradingView. This high probability, low risk set up is based on two principles. A volume spike in an upmove called professional sellingf followed by a change in trend to the downside and then a confirmation indicator called No Demand. The result speaks for itself. Got questions you can email Gavin directly at tradeguider@outlook.com Good trading, The TradeToWin team.Education07:44by gavinh102770
Oportunity mett prepationgetting ready for cpi we will let price unfold into the direction we currently have. the bias can change duw to the cpiLongby GOLDGANG10
2024-12-10 - priceactiontds - daily update - goldGood Evening and I hope you are well. tl;dr gold - Bullish but only until 2740ish. Bulls broke strongly above 2700 and the triangle is dead. Next stop is previous resistance around 2743. I do expect a pullback first, since the channel is obvious. Chart shows the preferred way for me. comment : Bulls are in control again. My chart is very clear, so I won’t try to make stuff up in here. 2678 should not be broken again and next target for the bulls is 2743ish. I expect a pullback down to 2710 or even 2700 before another leg up. If we break above the current channel, we will likely print 2800 before end of Friday. current market cycle: trading range key levels: 2680 - 2745 (above that is 2800 next) bull case: Chart tells the whole story for the bulls. Don’t make this more complicated as it is. Any pullback below 2710 is a decent buy with stop 2678. Invalidation is below 2678. bear case: Bears gave up once they could not reverse the market below 2670 again after y close and the early test down to 2683 in the EU session. Invalidation is above 2745. short term: Bullish. Look for longs near the lower channel line or 1h 20ema. medium-long term - Update from 2024-11-24: Likely to close 2024 above 2800 but I do think the recent selling was the first hint that we will transition into a trading range soon. current swing trade: None trade of the day: Buying the double bottom near 2680.Longby priceactiontds0
GC following navigators levels nicely last 2 day thus far . Retracements zones offering ideal areas to join the short term trend with our custom scriptby wildtrade10
Gold local short from an action lineIt is a good time to take a short from an action line of current down sloping action-reaction set. Also we are slowly breaking under resistance levels.Shortby 1234qwerUpdated 0
Gold Selling Opportunity: False Breakout at Range HighSelling opportunity for gold at the upper end of the range, likely experiencing a false breakout. I am expecting the price to revert back into the range.Shortby BlueSecUpdated 2
GOLD is out of range~!So why the hell am I on futures? Why not! Technical analysis is the same as always. Difference is...... Someone gets funded! For GC1! I am expecting a dip from this small range we are currently forming which will would be the liquidity hunt that is needed to burst into the level of 2.71k The level expected is are consecutive daily open/closes with a POC of a range. Longby christoferjuliussayco0
Safe Haven Volume-Weighted Cross-Asset Correlation Insights1. Introduction Safe-haven assets, such as Gold, Treasuries, and the Japanese Yen, are vital components in diversified portfolios, especially during periods of market uncertainty. These assets tend to attract capital in times of economic distress, serving as hedges against risk. While traditional price correlation analyses have long been used to assess relationships between assets, they often fail to account for the nuances introduced by trading volume and liquidity. In this article, we delve into volume-weighted returns, a metric that incorporates trading volume into correlation analysis. This approach reveals deeper insights into the interplay between safe-haven assets and broader market dynamics. By examining how volume-weighted correlations evolve across daily, weekly, and monthly timeframes, traders can uncover actionable patterns and refine their strategies. The aim is to provide a fresh perspective on the dynamics of safe-haven assets, bridging the gap between traditional price-based correlations and liquidity-driven metrics to empower traders with more comprehensive insights. 2. The Role of Volume in Correlation Analysis Volume-weighted returns account for the magnitude of trading activity, offering a nuanced view of asset relationships. For safe-haven assets, this is particularly important, as periods of high trading volume often coincide with heightened market stress or major economic events. By integrating volume into return calculations, traders can better understand how liquidity flows shape market trends. 3. Heatmap Analysis: Key Insights The heatmaps of volume-weighted return correlations across daily, weekly, and monthly timeframes provide a wealth of insights into the behavior of safe-haven assets. Key observations include: Gold (GC) and Treasuries (ZN): These assets exhibit stronger correlations over weekly and monthly timeframes. This alignment often reflects shared macroeconomic drivers, such as inflation expectations or central bank policy decisions, which influence safe-haven demand. Daily Weekly Monthly These findings highlight the evolving nature of cross-asset relationships and the role volume plays in amplifying or dampening correlations. By analyzing these trends, traders can gain a clearer understanding of the market forces at play. 4. Case Studies: Safe-Haven Dynamics Gold vs. Treasuries (GC vs. ZN): Gold and Treasuries are often considered classic safe-haven assets, attracting investor capital during periods of inflationary pressure or market turbulence. Volume-weighted return correlations between these two assets tend to strengthen in weekly and monthly timeframes. For example: During inflationary periods, both assets see heightened demand, reflected in higher trading volumes and stronger correlations. Geopolitical uncertainties, such as trade wars or military conflicts, often lead to synchronized movements as investors seek safety. The volume-weighted perspective adds depth, revealing how liquidity flows into these markets align during systemic risk episodes, providing traders with an additional layer of analysis for portfolio hedging. 5. Implications for Traders Portfolio Diversification: Volume-weighted correlations offer a unique way to assess diversification benefits. For example: Weakening correlations between Gold and Treasuries during stable periods may signal opportunities to increase exposure to other uncorrelated assets. Conversely, stronger correlations during market stress highlight the need to diversify beyond safe havens to reduce concentration risk. Risk Management: Tracking volume-weighted correlations helps traders detect shifts in safe-haven demand. For instance: A sudden spike in the volume-weighted correlation between Treasuries and the Japanese Yen may indicate heightened risk aversion, suggesting a need to adjust portfolio exposure. Declining correlations could signal the return of idiosyncratic drivers, providing opportunities to rebalance holdings. Trade Timing: Volume-weighted metrics can enhance timing strategies by confirming market trends: Strengthening correlations between safe-haven assets can validate macroeconomic narratives, such as inflation fears or geopolitical instability, helping traders align their strategies accordingly. Conversely, weakening correlations may signal the onset of new market regimes, offering early indications for tactical repositioning. 6. Limitations and Considerations While volume-weighted return analysis offers valuable insights, it is essential to understand its limitations: Influence of Extreme Events: Significant market events, such as unexpected central bank announcements or geopolitical crises, can create anomalies in volume-weighted correlations. These events may temporarily distort the relationships between assets, leading to misleading signals for traders who rely solely on this metric. Short-Term Noise: Volume-weighted correlations over shorter timeframes, such as daily windows, are more susceptible to market noise. Sudden spikes in trading volume driven by speculative activity or high-frequency trading can obscure meaningful trends. Interpretation Challenges: Understanding the drivers behind changes in volume-weighted correlations requires a strong grasp of macroeconomic forces and market structure. Without context, traders risk misinterpreting these dynamics, potentially leading to suboptimal decisions. By recognizing these limitations, traders can use volume-weighted correlations as a complementary tool rather than a standalone solution, combining it with other forms of analysis for more robust decision-making. 7. Conclusion Volume-weighted return analysis provides a fresh lens for understanding the complex dynamics of safe-haven assets. By integrating trading volume into correlation metrics, this approach uncovers liquidity-driven relationships that are often missed in traditional price-based analyses. Key takeaways from this study include: Safe-haven assets such as Gold, Treasuries, and the Japanese Yen exhibit stronger volume-weighted correlations over longer timeframes, driven by shared macroeconomic forces. For traders, the practical applications are clear: volume-weighted correlations can potentially enhance portfolio diversification, refine risk management strategies, and improve market timing. By incorporating this type of methodology into their workflow, market participants can adapt to shifting market conditions with greater precision. When charting futures, the data provided could be delayed. Traders working with the ticker symbols discussed in this idea may prefer to use CME Group real-time data plan on TradingView: www.tradingview.com - This consideration is particularly important for shorter-term traders, whereas it may be less critical for those focused on longer-term trading strategies. General Disclaimer: The trade ideas presented herein are solely for illustrative purposes forming a part of a case study intended to demonstrate key principles in risk management within the context of the specific market scenarios discussed. These ideas are not to be interpreted as investment recommendations or financial advice. They do not endorse or promote any specific trading strategies, financial products, or services. The information provided is based on data believed to be reliable; however, its accuracy or completeness cannot be guaranteed. Trading in financial markets involves risks, including the potential loss of principal. Each individual should conduct their own research and consult with professional financial advisors before making any investment decisions. The author or publisher of this content bears no responsibility for any actions taken based on the information provided or for any resultant financial or other losses.Educationby traddictiv1
Gold Idea - 09/12/2024This plan is for Monday, but as we know, Mondays tend to have more volatile market movements. This plan might not work well in such scenarios. This plan is specifically designed for Mondays with a sideways market only.by Chanon_TemchaiUpdated 111
#202449 - priceactiontds - weekly update - gold futuresGood Evening and I hope you are well. tl;dr gold futures: Boi does this market blow at the moment. Nested triangles on multiple time frames and that’s as neutral as it gets. I doubt bulls can even get it above 2700 again at this point. 2660 is the midpoint for now and the range is big, so either buy low and sell it inside of it or wait for a bigger breakout. Bulls need something above 2750 and bears below 2560. Huge range. A lot of traders that have bought above 2700 are underwater. The longer this stays below it, the less likely it is to get back up there. Quote from last week: comment: Talk about you can’t time the market. Pretty ducking good call that was from the above outlook last week. Higher low, and lower high. Triangle on the daily, very bullish above and very bearish below. Not rocket science to read this. I do think bulls are slightly favored. comment: I won’t waste much time with this market this week. Clear triangle and market is in total balance around 2660. Wait for the breakout or play the range. My best guess would be that we both see 2600 and 2700 in the next 3 weeks. current market cycle: trading range key levels: 2600 - 2700 bull case: Bulls breakout point is 2750 and that is far away. Buying below 2650 has been profitable the past 2 weeks but bulls could not close one single day above the 20ema. Best to wait until we clearly see a winner here. Daily close above 2700 would be a great start for bulls. Invalidation is below 2630. bear case: Bears need to break 2627 for testing 2600 and then it’s the big bull trend line. If they would somehow manage to break even that, last support is 2568 before we go down to 2500. Invalidation is above 2700. outlook last week: short term: S lightly bullish if we stay above 2630. Max bullish above 2750. → Last Sunday we traded 2681 and now we are at 2659. We stayed above 2630 and went nowhere. Meh outlook. short term: Neutral inside given range. medium-long term - Update from 2024-12-07: No bigger opinion on this for the rest of 2024. Market is in balance until we see a new impulse. current swing trade: None chart update: Removed bullish two-legged move up.by priceactiontds0
Waiting for a breakout towards Demand/Supplyhere's my analysis of GC1, as you can see I've marked my Supply and Demand area where price will react to, and previously the market was in a downtrend and CHoC occurred which formed our HH and HL, and between these we have our small range which indicates that neither the Bulls or Bears are in control. My analysis shows that its best to wait for a breakout on the Highest High or on the Highest low then we can enter our trades, the price can breakout either way so it's best to wait, TP will either be Demand/Supply area, use H1 for candlestick confirmationby StarleXtheTrader1
goldGold can continue its correction trend with small fluctuations in this range and correct to 2580 and 2500. Given the breakout of the uptrend, there appears to be potential for a correction and initial signs have formed.Shortby meetingtrade0
Gold Range-Bound: Watch 2640 for BreakdownGold fell today but remains within its established range. To confirm further downside, a break below 2640 is needed. While my bias is bearish, there is still potential for price to return to the range, which is between 2645 and 2680.Shortby BlueSec111
2024-12-05 - priceactiontds - daily update - goldGood Evening and I hope you are well. tl;dr gold - Neutral. Death zone is 2644 - 2688. Until we break out of it, I will not touch it again. Unchanged. But the accuracy is pretty amazing so far. I am not touching this but longs are preferred below 2650 for trading back up to 2670+. comment: Clear trading range so don’t over analyse it. 2644 has to hold for the bulls and bears need to stay below 2680 tomorrow. As long as these prices hold, you have to trade the range and mean reverse. Market is in total balance, so don’t try to guess where the next breakout will happen. current market cycle: trading range key levels: 2644 - 2680 bull case: If bulls fail at 2644, 2630 comes next and then the big bull trend line around 2620ish. They desperately need a close above 2680 if they want a buy signal going into next week and even then the upside is probably limited to 2700 and the bear trend line. Invalidation is below 2610ish. bear case: Bears are preventing the market from closing above the daily ema but fail to make new lows below 2644. No side has an advantage and if you don’t like scalping, it’s best to wait for a clear new trend. If bulls were strong and wanted to close this year above 2800, we would probably have seen it by now. Invalidation is above 2700. short term: Neutral. Market is in balance around 2630. medium-long term - Update from 2024-11-24: Likely to close 2024 above 2800 but I do think the recent selling was the first hint that we will transition into a trading range soon. current swing trade: None trade of the day: Selling above 2675 has been profitable since Monday.by priceactiontds0
Gold Positioning: Medium-Term Shorts with Long-Term Bullish OutlI am currently holding a medium to long-term bullish position on gold, with a target range of $2200-$2250. For the medium term, I am also taking short positions, with key stop levels identified before reaching the $2250 area.Shortby BlueSecUpdated 2
Short Position on GoldEntering a short position on Gold at 2680 to further build on my medium- to long-term bearish stance.Shortby BlueSecUpdated 4