GOLD DECEMBER FUTURES WEEKLY GOLD WEEKLY ALERT
After sharp corrective pullback yesterday, gold bounced back to trade around 2750.00.
Price is currently in wave 3 targeting 2785 to 2795 area initially.
After wave 3 is completed we may see a sharp corrective pullback that is WAVE 4 targeting 2676 to 2700 area.
Wave 5 will then target the final rally towards 2805.00 to 2835 area.
Gold Mini Futures
GOLDM1! trade ideas

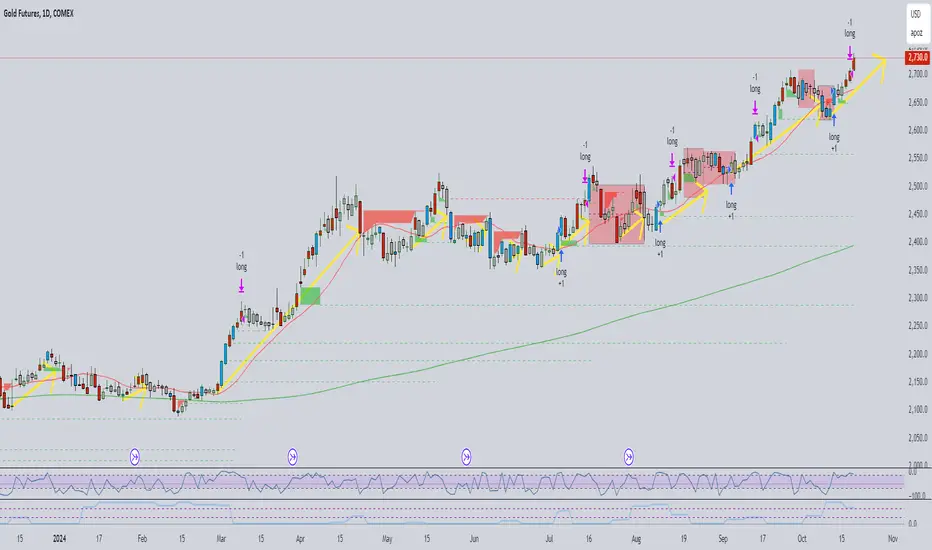
Part one....... gold as the example of new highs10.23.24 it is very difficult to trade markets that make new all-time highs. I can only guess from my own experiences that this will be a similar experience for other Traders..... the price action is bullish and yet you're expecting a breakout to retest to a lower value because you're waiting for buyers to close their long position to avoid a drawdown.... especially if the market has given you a good return and now you're worried about the market reversing and you would be worried that it will give back all or most of your entry if you took the position that the market made a new high and you should therefore go along.... markets and knowledgeable smart money is aware of the problems associated with markets that make new all-time highs.
I will try to make my point of view in 2 or 3 videos.

XAU Future History Repeats itselflimited supply casues prices to go up.. hisotry says it beats the markets during hard times if you know what i mean.. we are crashing either nov7 or soon

GOLD Explodes Past All Targets – Massive Gains Achieved!The long trade on GOLD entered at 76195 has surged with incredible momentum, hitting all our profit targets. The current price stands at 78375, confirming the strength of this bullish run.
Key Levels
Entry: 76195 – Long entry made as the uptrend was confirmed.
Stop-Loss (SL): 76062 – Strategically placed to manage downside risk.
Take Profit 1 (TP1): 76358 – Successfully reached, signaling the first leg of the rally.
Take Profit 2 (TP2): 76622 – Continued bullish movement hit this target.
Take Profit 3 (TP3): 76887 – Strong momentum allowed this target to be met.
Take Profit 4 (TP4): 77050 – Final target achieved, capping off a solid bullish trade.
Trend Analysis
The price has maintained consistent support above the Risological dotted trendline, affirming a robust uptrend. The consistent climb from TP1 to TP4 highlights the power of this movement, with all targets now realized.

How to Position if you Missed the Gold RallyGold prices have reached another all-time high, supported by strong bullish momentum. However, the composition of buyers has shifted. While central banks fuelled the previous phase of the rally, institutional investors and retail buyers are now leading. Over the past six months, ETF inflows have totalled nearly $5 billion, and asset managers continue to build net long positions, nearing the peak levels seen during the pandemic.
Despite the bullish outlook, higher prices are tempering demand and reducing the potential for future returns. As an alternative, investors can opt for a tactical position using CME Micro Gold futures and the Van Eck Gold Miners ETF (GDX).
RATE CUTS ARE A GOLD DRIVER
Over the past four easing cycles, gold prices have appreciated by 10% following the start of Fed rate cuts. This time around, prices are up 5% since the first rate cut in September. That leaves room for further gains as the Fed cuts further.
Still, it is crucial to consider that gold prices are already trading at an all-time-high. Higher prices are pressuring further gains and consumer demand.
According to Prithviraj Kothari, president of the India Bullion and Jewellers Association (IBJA), gold demand during this year’s festival season in India is likely to be 20% lower YoY in terms of quantity of gold purchased.
CENTRAL BANK BUYING NO LONGER THE DRIVING FACTOR
Since April, the People's Bank of China (PBoC) has halted gold purchases, while Poland and India acquired 24.3 tons and 17.7 tons of gold, respectively, between June and August, exceeding their purchases from March to May. However, the pace of buying from these central banks may be slowing. The latest data from the Reserve Bank of India (RBI) shows a decline in gold reserves by $98 million to $65.6 billion, indicating a slowdown in gold accumulation despite still substantial holdings.
One of the largest buyers of gold this year, Turkey, also slowed its pace of purchases as it acquired just 7.9 tons of gold between June and August compared to 27.6 tons between March and May.
Source: World Gold Council
Additionally, the urgency for central banks to buy gold has lessened. Earlier, rising yields and a strong U.S. dollar prompted increased gold buying. As U.S. interest rates decrease, a weakening dollar is expected.
ASSET MANAGERS NET LONG POSITIONING IS NEAR ALL-TIME-HIGH
Asset Manager net long positioning has increased consistently over the last six months. It is near the highest level since the pandemic and 2016. Crucially, the increase in long positioning has been driven by both increasing longs and declining shorts indicating bullish consensus among asset managers.
SUBSTANTIAL ETF INFLOWS OVER THE PAST 6 MONTHS
Gold ETFs listed in the US have accumulated USD 4.9 billion in inflows over the past 6 months. Inflows have grown by more than USD 1.7 billion since the Fed cut rates in September. While substantial outflows were observed on 8/Aug as global markets fell sharply, the decline was reversed in just 2 weeks.
Gold ETF inflows tend to follow cyclical patterns, and their current levels are relatively modest compared to previous inflow cycles, which have been significantly larger.
Substantial flows to gold ETFs and rallies in gold prices also tend to trigger flows into gold miner ETFs. Though these flows tend to lag flows into gold ETFs by several months.
GOLD MINERS HAVE STARTED TO CATCH UP
The outlook for gold remains mixed. While bullish momentum is supported by the anticipation of a Federal Reserve easing cycle, gold is already near all-time highs, which is discouraging further investment, particularly from retail investors.
A strategic way to capitalize on the later stages of a gold rally is through gold mining stocks. Gold miners typically lag behind gold during rallies, as returns from equities take longer to materialize and involve greater risk compared to direct gold investments. However, the impact of higher gold prices on miners' profitability is clear. In Q2 2024, Barrick, the world's largest gold miner, saw net income rise by 24% quarter-over-quarter, driven by a 13% increase in realized gold prices. Similarly, Newmont's net income increased by 32%, alongside a 12.3% rise in gold prices.
Gold miners are also benefiting from easing cost pressures. While costs remain high compared to last year due to inflation and energy-related increases, they improved in Q2, and further reductions are expected based on company guidance.
The gold to gold miner ratio is a cyclical quantity that has been trending higher for decades but also tends to mean-revert when the ratio edges to far in either direction.
As the ratio is due to cross the 200-week moving average, it may be due for an extended period of decline favouring gold miners.
HYPOTHETICAL TRADE SETUP
Gold remains bullish through the Fed easing cycle and strong investment demand provide momentum. However, higher prices are dampening consumer demand and central bank buying is slowing. Further increase in gold is likely, however, further gains may be limited. Gold prices have already realized half of their average increase following a rate cut.
Alternatively, a position that is long on gold miners also benefits from rising gold prices.
Gold prices, as tracked through gold futures, are highly correlated with gold miners, measured by ETFs like GDX and SGDM, with a correlation coefficient typically near 0.9, though there are occasional period breaks. Since December 2023, gold prices have outperformed SGDM by nearly 20% and GDX by 5%.
As the current gold rally progresses, increased flows into gold miner ETFs are expected to support their prices. Additionally, improving cost structures for miners and higher realized gold prices create positive momentum.
Investors can hedge a long position in GDX by taking a short position in CME Micro Gold futures. This hedge protects the ETF position against potential declines in gold prices. The smaller contract size of CME Micro Gold futures makes them ideal for precise hedging, particularly given the smaller unit size of ETFs like SGDM.
637 units of GDX (at a price of 43.15 as of 18/Oct) are balanced by a hedge of 1 CME Micro Gold futures contract expiring in December. CME Micro Gold Futures require margin of just USD 1,100 while the GDX leg requires notional of USD 27,470.
The position offers multiple income-generating advantages. The GDX ETF provides a net dividend yield of 0.65% (after accounting for the management fee), and the short position in CME Micro Gold futures benefits from contango, which adds approximately 1% per quarter.
The payoff scenarios for this position are provided below:
MARKET DATA
CME Real-time Market Data helps identify trading set-ups and express market views better. If you have futures in your trading portfolio, you can check out on CME Group data plans available that suit your trading needs tradingview.com/cme .
DISCLAIMER
This case study is for educational purposes only and does not constitute investment recommendations or advice. Nor are they used to promote any specific products, or services.
Trading or investment ideas cited here are for illustration only, as an integral part of a case study to demonstrate the fundamental concepts in risk management or trading under the market scenarios being discussed. Please read the FULL DISCLAIMER the link to which is provided in our profile description.

This is Wyckoff VSA Upside Down In this short video produced by Author of "Trading in the Shadow of the Smart Money", Gavin Holmes, we turn all the Volume Spread Analysis indicators upside down, so red becomes green and green becomes red, but the principles and alerts we use don't change.
In this example we use the GC contract, Gold Futures, to demonstrate this.

#202442 - priceactiontds - weekly update - goldGood Evening and I hope you are well.
tl;dr
gold: 4 consecutive good bull bars last week and we are on our way to 2800. I have two trend lines pointing to at least 2760, so the last thing I want to be here is bearish. Clearly W5 of this rally and we will likely see bigger profit taking into year end or early next year.
Quote from last week:
comment: Longer pullback than expected and stopped out on a long but got back in since 2620 held and bulls rallied hard on Friday. I do think it’s bullish only and we will likely make a new ath and also a decent chance to break above again for 2750+.
comment: Bullish it was and still is. 2800 is the next big target to hit. After 4 very strong consecutive bull bars, you can not hold a bearish thought while the market makes daily new ath. Two upper bull trend lines are still to hit, one of them leads to 2760 and the other to 2800. On the monthly chart we are in a 8 month micro channel upwards without any selling pressure. At some point market will pull back more and we will see a correction but until we see much greater selling pressure, we can not trade on hope.
current market cycle: very strong bull trend
key levels: 2650 - 2800
bull case: All arguments are on the bull side and they have a big round number ahead. Any pullback will likely be bought, unless some event would change that.
Invalidation is below 2650.
bear case: Bears got nothing right now. If they somehow break below the most recent trend line below 2650, that would be a start but they would have to keep the market below 2700 then and make it go more sideways longer before it can reverse more. They know it’s the third leg up (W5) and 2800 is the obvious target. Most will likely not do much until we hit it.
Invalidation is above 2820.
outlook last week:
short term: Bullish for 2700+
→ Last Sunday we traded 2676 and now we are at 2730. Perfect outlook, hope you made some.
short term: Bullish for 2800.
medium-long term - Update from 2024-09-22: Very strong breakout above, again. Market currently has no ceiling. Most likely 2700 next and I do think 3000 could be a potential target if we continue. There is certainly an argument for a measured move based on the bull rally from 2018-08 to 2020-08.
current swing trade: None
chart update: Added latest bull gap

GOLD | XAUUSD Weekly Outlook Oct 21st: Keep BUYING!This weekly forecast is for Oct. 21 - 25th.
Gold is still bullish, and BUYS are still the best bet. The formation of a +FVG will support higher prices, and we may get that on Monday's close.
Check the comments section below for updates regarding this analysis throughout the week.
Enjoy!
May profits be upon you.
Leave any questions or comments in the comment section.
I appreciate any feedback from my viewers!
Like and/or subscribe if you want more accurate analysis.
Thank you so much!
Disclaimer:
I do not provide personal investment advice and I am not a qualified licensed investment advisor.
All information found here, including any ideas, opinions, views, predictions, forecasts, commentaries, suggestions, expressed or implied herein, are for informational, entertainment or educational purposes only and should not be construed as personal investment advice. While the information provided is believed to be accurate, it may include errors or inaccuracies.
I will not and cannot be held liable for any actions you take as a result of anything you read here.
Conduct your own due diligence, or consult a licensed financial advisor or broker before making any and all investment decisions. Any investments, trades, speculations, or decisions made on the basis of any information found on this channel, expressed or implied herein, are committed at your own risk, financial or otherwise.

gold futurethis is the strucutre of the past repeating itself
i did not fully finsh it but did give many years ahead i belive this will be my new ticker
to the top is 2 years then the drop is 4 years and the second part cycle starts i will publish a new one when the time comes

gold trading secret: long gold on thursday if price below 18 smagold trading secret: long gold on thursday if price is below 18 sma
obviously this works now because we are in an uptrending market, but look at the charts in sidesways and downmoving phases, thurday morning seams to be a pretty good spot to enter long
What next for Gold Gold has been pushing to new highs and continues to look strong, aided by political and geographical issues globally.
From a technical perspective, I can see a retracement coming in the coming weeks before the final push to my targets.

Gold Waves AnalysisGold Waves Analysis based on the elliot waves calculation, Neo waves analysis, monthly RSI, volume analysis, price action scenarios!


WEEKLY FOREX FORECAST OCT. 14 - 18th: GOLD | XAUUSD Gold is still bullish, and BUYS are still the best bet. There is the potential for an overdue retracement, but I suspect it will be limited. The formation of a +FVG will support higher prices, and we may get that on Monday's close.
Patience....
Check the comments section below for updates regarding this analysis throughout the week.
Enjoy!
May profits be upon you.
Leave any questions or comments in the comment section.
I appreciate any feedback from my viewers!
Like and/or subscribe if you want more accurate analysis.
Thank you so much!
Disclaimer:
I do not provide personal investment advice and I am not a qualified licensed investment advisor.
All information found here, including any ideas, opinions, views, predictions, forecasts, commentaries, suggestions, expressed or implied herein, are for informational, entertainment or educational purposes only and should not be construed as personal investment advice. While the information provided is believed to be accurate, it may include errors or inaccuracies.
I will not and cannot be held liable for any actions you take as a result of anything you read here.
Conduct your own due diligence, or consult a licensed financial advisor or broker before making any and all investment decisions. Any investments, trades, speculations, or decisions made on the basis of any information found on this channel, expressed or implied herein, are committed at your own risk, financial or otherwise.

GOLD is Setting Up For LONGS! Prepare to BUY!Price is pulling back to the Daily +FVG, which is nested in the Weekly +FVG, which is intersected by the Swing High. Three strong confluences for a high probability LONG.
Be patient, look for price to contact the POI, and then let your valid buy setup form.
Let the rest unfold.
Enjoy!
May profits be upon you.
Leave any questions or comments in the comment section.
I appreciate any feedback from my viewers!
Like and/or subscribe if you want more accurate analysis.
Thank you so much!
Disclaimer:
I do not provide personal investment advice and I am not a qualified licensed investment advisor.
All information found here, including any ideas, opinions, views, predictions, forecasts, commentaries, suggestions, expressed or implied herein, are for informational, entertainment or educational purposes only and should not be construed as personal investment advice. While the information provided is believed to be accurate, it may include errors or inaccuracies.
I will not and cannot be held liable for any actions you take as a result of anything you read here.
Conduct your own due diligence, or consult a licensed financial advisor or broker before making any and all investment decisions. Any investments, trades, speculations, or decisions made on the basis of any information found on this channel, expressed or implied herein, are committed at your own risk, financial or otherwise.

GOLD..BuyGave a good flag breakout...on to the last leg up...tgt calculated as per pattern...Looks good for the tgt..So buy ...Time tgt approx early next year

2024-10-16 - priceactiontds - daily update - goldGood Evening and I hope you are well.
tl;dr
Gold - Bulls got the breakout above and got rejected at 2700 again. I think we will spend a bit more time at the highs until bulls give up or we find more buyers willing to buy above 2700. Right now I still favor the bulls for continuation but only willing to buy on strong momentum.
comment : Retest 2700 is done, now what? We have a proper channel, so trade it. 2690 right now is not a good spot. Wait for a closer price to the lower trend line or look for shorts near 2700, if bulls show weakness again. New highs inside the channel are getting sold, so you should not buy into strength but rather on pullbacks.
current market cycle: bull trend (also trading range on the daily chart - 2619 - 2710)
key levels: 2670 - 2710
bull case: Bulls will likely retest 2700 tomorrow. Can they get another big breakout above it? I think so but right now it does not look like it. I expect more sideways until the bull trend line on the daily chart is closer. Bulls still in full control and I would not look for shorts on this.
Invalidation is below 2670.
bear case: Bears selling new highs but thats about it. Market is grinding higher again and we are near the ath. Nothing bearish about this. Bears can start a case if they close below 2670 again.
Invalidation is above 2720.
short term: neutral - I would not buy 2700 in hope of 2710 but rather buy decent pullbacks inside the current channel.
medium-long term - Update from 2024-09-22: Very strong breakout above, again. Market currently has no ceiling. Most likely 2700 next and I do think 3000 could be a potential target if we continue. There is certainly an argument for a measured move based on the bull rally from 2018-08 to 2020-08.
current swing trade: None
trade of the day: Selling 2700.

Dxy gold silver Weimar Republic 10 16 24. here the dxy may be coming to sellers and this is where I would expect a reversal. the dxy and the metals have been going higher which is not typical. this is probably a signal that the metals are bullish which means there are buyers. on the other hand if the gold or the silver trade lower.... that would be possibly a good time to buy the metals, and I explain this in the video. this is a very dangerous time and a lot of people feel that the US must change its strategy because the dollar cannot be sustained with The amount of spending that has occurred.

Gold looks to be drawing to the upside... My conviction for gold is that it is drawing towards the upside... I'm noticing daily failure swings that price seems to be very interesting in buy side liquidity. Plus price has reacted nicely off a +IFVG and has formed a daily CISD. I'll be looking for a OLHC daily candle formation for tomorrow trading toward the weekly draws.

The Wyckoff VSA Method Showing Selling and No Demand In this short video, Author of "Trading in the Shadow of the Smart Money", Gavin Holmes, explains one of the most important trades to the short side, and ironically it works in any timeframe as shown. This is Gold Futures, but if you look at the NQ today as I filmed this it also set up early to the short side in NVIDIA, ARM and the NQ Futures.

One More Gold Short Left in the ChamberGold is showing signs of weakness after testing resistance during the early trading session. With recent volatility and strong moves in the U.S. dollar, I’m expecting bearish momentum to continue intraday.

GOLD SELL SET UPI have a 4hr up trend that was broken on the 1hr. I got a 1hr retest, now Im lookn to take it down to the next previous low of around 2,573.
HAPPY TRADING EVERYONE!!!

Bitcoin halts as gold advances (and vice versa)
THIS HAS PLAYED OUT, AGAIN!
Bitcoin halted its advance as gold broke out.
Now bitcoin's hope is that gold stalls...
#bitcoin #gold
