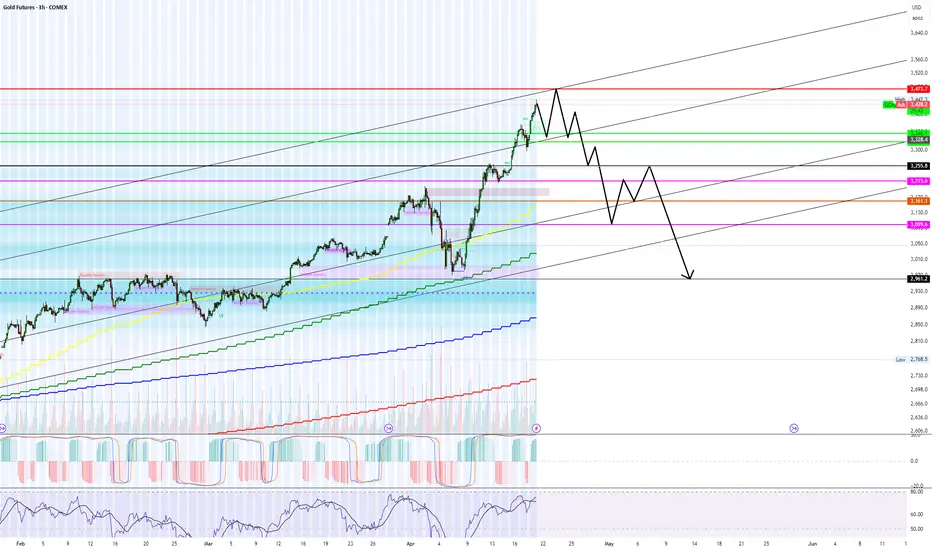
Agree to disagree... Gold is topping right now.My price path seen above is a complete guess but it stems from long term trend lines and more importantly order flow from last week.
On Thursday there was a #1 trade on AMEX:PHYS for $200+ Million at the green levels in my chart above (Equivalent levels). PRICE WILL 100% go to my green lines by end of this week 04/25.
We are over shooting the dark pool sale but a lot, however, this is always to trap retail and create fomo/peak fear.
In the correction/recession cycles, gold ALWAYS TOPS LAST before the crash...
GOLDPETALK2025 trade ideas
Gold Making New Highs! Will it continue?Took a mental break for a second to give price a chance to show more of what it wanted to do. Now that we are in a new week expecting the bullish price action to continue. We are just waiting for the right moment to enter the position.

Now that we Have our Pullback...Back to BULLISHNESSBeen waiting on this pull back. Now that we got it price should move more reasonably. Looking for the bullish action to continue and new highs to be made.

GC (gold) UpdateSo I managed to dump my GLD holdings Tues premarket (left a comment on one of my posts Tuesday morning) because I realized that gold was doing a three drive pattern, got a pump at the end which started to sell off premarket. Not to mention, it had hit the target I posted with the big green arrow.
Also, we have confirmation that my 3 hr indicator does work on GC, it bounced when MFI hit my red line. Did not play it, and it's a pretty weak bounce. GC isn't behaving the same as it did on its way up, I think there are bagholders that bought on the way down that are selling now on the way up. Every pump pump just gets sold off, there were some pumpers afterhours today, but that pump sold off and looks to me like it wants to go red tonight.
Going to wait until I see a big move before I play this again. I think the only reason why it's a little green tonight is because they're pumping commodities, and gold is a commodity. The Euros might sell it off though, seems like they are always the sellers, guessing the gold algos are mainly run by them.
I don't plan on shorting but if you do, the time to do it is when MFI hits overbought.

Gold correctionPrice movement started upward from blue arrow mark. It can tesr mercilessly test black line drawn level.

Gold Futures – Short-Term Technical Outlook as of April 23Gold surged to nearly $3,500, but multiple indicators now point to a potential top. A short-term correction or consolidation phase appears likely before any new highs.
Bearish Signals Across the Board:
RSI Divergence: RSI failed to confirm recent highs, showing bearish divergence.
Momentum Fading: MACD & momentum oscillators rolled over → rally exhaustion.
Volume Shift: Rising on down moves, drying up on rallies → classic distribution.
Bearish Candlesticks: Spinning tops + bearish engulfing patterns signal reversal risk.
Elliott Wave: Likely completed 5-wave impulse → next up: ABC correction?
Cycles: April top aligns with intermediate cycle peak → watch May for cycle low.
Seasonality: Historically weak May–June period approaching.
COT Data: Speculators still long, but commercials heavily short → caution warranted.
🎯 Trade Setups
Short-Term (1–5 Days)
🎯 Short Entry: ~$3,400
📉 Target: $3,270 → $3,215
🛑 Stop: Above $3,460
Medium-Term (1–4 Weeks)
📉 Short below $3,215 → Target $2,970
✅ Or go long on confirmed bounce at $3,150–$3,180
Long-Term (1–6 Months)
🟢 Bullish bias after correction completes
🛒 Buy zones: $2,960–$2,720
🎯 Targets: $3,540 → $3,900+
⛔ Stop: Below $2,700
🧭 Outlook Summary:
Bias: Cautiously Bearish (short-term) → Bullish (long-term)
Gold likely topped in April — expect weakness or sideways action before the next major leg higher. Be patient for a better buying opportunity later this spring/summer.

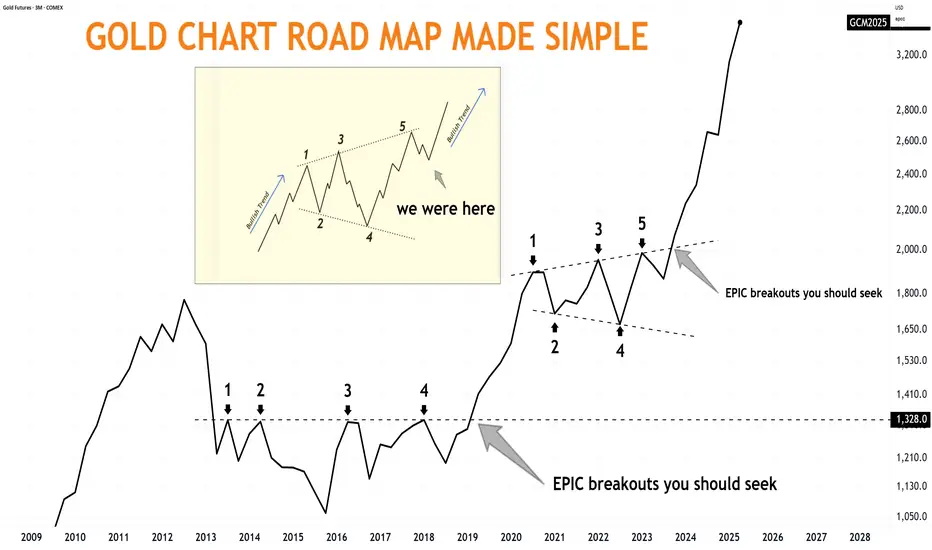
Gold is up over $1500Since I did this post back in August 2023.
Gold is up over $1500 in less than 2 years.
EPIC breakouts you should seek
The Gold-Silver Ratio ExplainedCOMEX: Micro Gold Futures ( COMEX_MINI:MGC1! ), Micro Silver Futures ( COMEX_MINI:SIL1! )
The Gold-Silver Ratio is a financial term that measures the relative value of gold to silver. Specifically, how many ounces of silver it takes to buy one ounce of gold.
The Gold-Silver Ratio is an important tool for traders and investors. It has been used to indicate the market sentiment towards these two precious metals. A high ratio suggests that gold is more valued than silver, often seen during economic turmoil or when investors seek safe-haven assets. On the contrary, a lower ratio implies that silver is gaining value relative to gold, which normally occurs during periods of economic growth and strong industrial demand.
The ratio fluctuates over time due to supply and demand dynamics, geopolitical events, and changes in the global economy. By analyzing the ratio, traders can make informed decisions about when to buy or sell. This ratio reflects not only the market’s valuation of these metals but also an instrument for profit-making in the commodities market.
Historical Gold to Silver Ratio
Since 2000, the Gold-Silver Ratio has seen considerable fluctuations, reflecting various economic and market conditions. In the first decade of the 21st century, the ratio hovered around 65:1, meaning it took 65 ounces of silver to buy one ounce of gold.
However, the ratio has spiked during times of economic uncertainty. For example, during the financial crisis of 2008, the ratio reached highs not seen in decades. More recently, in the wake of the COVID-19 pandemic and the ensuing economic turmoil, the ratio surged, at one point exceeding 110:1 in 2020, indicating a strong preference for gold as a safe-haven asset compared to silver.
Over time, the Gold-Silver Ratio has been trending up, meaning gold has gained value at a faster pace compared to silver.
As of last Friday, gold is trading around all-time high at $3,330, while silver is quoted at $33.0. This makes the Gold-Silver Ratio almost exactly at 100.
When to Buy and Sell based on the Gold-Silver Ratio?
The decision to buy or sell the ratio hinges on interpreting its current value in the context of historical trends and market conditions.
When to Buy Silver: A high Gold-Silver Ratio, typically at or above the 90:1 mark, suggests that silver is undervalued relative to gold. This is often interpreted as a buying signal for silver. In such scenarios, silver is cheaper than gold, and investors may see it as an opportunity to purchase silver at a relatively low price. The rationale is that if the ratio decreases, the relative value of silver will increase compared to gold, potentially leading to significant gains.
When to Sell Silver/Buy Gold: Conversely, when the Gold-Silver Ratio is low, say around 50:1, it indicates that silver is relatively expensive, or gold is undervalued. In such situations, investors might consider selling silver and buying gold. The expectation is that the ratio will normalize or increase, meaning that gold’s value could rise relative to silver, offering a favorable return on the gold investment.
The Gold-Silver Ratio can be a valuable indicator of when to buy or sell gold and silver. However, since the ratio is not stable but upward trending over time, we could not use a mean-reversion strategy. The price band for normal, high and low ranges should be updated regularly.
Trade Setup with Micro Gold and Silver
Traders could deploy the Gold-Silver Ratio trading strategy using COMEX Micro Gold Futures ( AMEX:MGC ) and Micro Silver Futures ( AMEX:SIL ). The big advantages of using futures contracts are capital efficiency and leverage.
MGC contracts have a notional value of 10 troy ounces of gold. With Friday settlement price of $3,330.7, each June contract (MGCM5) has a notional value of $33,307. Buying or selling one contract requires an initial margin of $1,500 at the time of writing.
By putting a deposit equivalent to less than 0.5 ounce, traders could gain the full exposure to 10 ounces of gold. If gold prices move up by 5%, a long futures position would double in value (= (33307*0.05) / 1500 = 111%). This futures contract has a built-in leverage of 22:1.
Conversely, Micro Silver (SIL) contracts have a notional value of 1,000 troy ounces of silver. With Friday settlement price of $33.02, each June contract (SILM5) has a notional value of $33,020. Buying or selling one contract requires an initial margin of $3,000 at the time of writing.
By putting a deposit equivalent to 91 ounces, traders could gain the full exposure of 1,000 ounces of silver. If silver prices move up by 5%, a long position in Micro Silver futures would gain 55% (= (33020*0.05) / 3000). This futures contract has a built-in leverage of 11:1.
Micro gold futures (MGC, 10 oz) contracts tap into the deep liquidity of standard-size gold futures contracts (GC, 100 oz). As of last Friday, GC has an open interest (OI) of 447,356 contracts, while the OI for MGC is 44,449, according to data from CME Group.
The OI for standard Silver Futures (SI, 5000 oz) and Micro Silver Futures (SIL, 1000 oz) are 154,276 and 12,345, respectively.
Happy Trading.
Disclaimers
*Trade ideas cited above are for illustration only, as an integral part of a case study to demonstrate the fundamental concepts in risk management under the market scenarios being discussed. They shall not be construed as investment recommendations or advice. Nor are they used to promote any specific products, or services.
CME Real-time Market Data help identify trading set-ups and express my market views. If you have futures in your trading portfolio, you can check out on CME Group data plans available that suit your trading needs www.tradingview.com

GC UpdateNot sure if this is a melt up or not, bit strange that RSI and MFI are moving in opposite directions.
I have a long term position set up, but I'm not planning on doing big options plays unless MFI hits the red line or if I expect the stock market to drop. I might play a little tomorrow for TSLA earnings, lol. (TSLA has dropped so much it's only 2.6% of QQQ, it won't be able to tank the market on its own.)
I think the next big gold movement happens when the China electronics tariff is announced. No idea when that happens. The market is just a guessing game with Orange Man in charge.
In any case, I have a EUROTLX:4K target for gold, don't really care if I have to wait a few months or a year or whatever. This seems like a safer bet than anything else.

Gold-Silver Ratio: Silver’s Lag and Historical DivergencesThe gold-silver ratio - the number of silver ounces equals in value to one ounce of gold – has surged recently as gold prices rally while silver underperforms. Gold, a traditional safe-haven, has climbed to record highs amid economic uncertainty, whereas silver, which is partly an industrial commodity, has struggled to break past $35/oz. As a result, the ratio is around 100 – meaning gold is ~100 times the price of silver despite the correction in the ratio from its peak around 125.
For context, the ratio averaged 57 from 1975-2000, and between 2000-2025 the ratio has ranged from 32 and 125 (with the max level reached this month with an average of 68. The ratio has observed extreme spikes in unusual crises).
Today’s elevated ratio highlights the divergence between gold’s sharp rally and silver’s lagging performance. The 25-year mean of the ratio is at 68, suggesting the present levels (100) represent an extreme deviation in favour of gold.
Historical Parallels in Gold-Silver Divergences
Similar wide divergences between gold and silver have occurred in the past. Key historical episodes illustrate how silver eventually played “catch-up” after lagging gold – albeit with varying lag times:
1970s – Silver’s Late Surge: After the U.S. abandoned the gold standard, gold prices soared while silver lagged. However, silver eventually staged a sharp rally later in the decade, quickly closing the gap and driving the gold-silver ratio sharply lower.
1980s – Prolonged Underperformance: Following the 1980 peak, precious metals collapsed, with silver suffering far more than gold. The gold-silver ratio surged and remained elevated through the 1980s and 1990s, as silver failed to catch up and largely moved sideways until the 2000s.
Early 2000s – Post-Recession Catch-Up: After the 2001 recession, gold began a
new bull market while silver initially lagged. Eventually, silver outpaced gold’s gains over the next several years, significantly narrowing the gold-silver ratio.
2008 Financial Crisis – Sharp Divergence and Recovery: The 2008 crisis caused gold to outperform sharply as silver collapsed. However, as the economy recovered, silver staged a dramatic rebound, quickly closing the gap and normalizing the ratio by 2011.
Why Is Silver Lagging Now? Industrial Demand Uncertainty
Roughly half of silver demand is industrial (electronics, photovoltaics, chemicals). Persistent worries about a global manufacturing slowdown and elevated inventories have capped silver’s upside just as investors have chased gold for geopolitical protection.
Source: Silver Institute
Worries about industrial demand have been exacerbated by the recent trade uncertainties which impact industrial sectors in an outsized manner.
By contrast, gold’s appeal as a safe haven has been boosted by geopolitical and inflation fears, driving it to record highs in 2025.
Despite cyclical swings, the underlying secular trend has crept higher for decades. Gold’s monetisation (central-bank reserves, ETF holdings surge) versus silver’s demonetisation, higher real production costs for gold, and silver’s growing industrial elasticity are all factors that represent a risk to normalization of the GSR.
Even a forceful mean-reversion might therefore stall nearer 60–70 than the sub-40 extremes of earlier cycles.
Hypothetical Trade Setups
History shows that once macroeconomic uncertainty clears, silver often recovers lost ground quickly. In previous periods of extreme gold-silver divergence, from the 1970s through 2008, silver staged strong rallies that pushed the gold-silver ratio (GSR) back toward normal levels.
Today, however, silver’s outlook remains clouded by uncertainty, particularly amid the ongoing trade war. Prices risk stalling below resistance around $35/oz. Consequently, the normalization in the GSR may instead result from a correction in gold prices. Gold has consistently broken record highs, and its long-term outlook remains firmly bullish. Nevertheless, concerns about the sustainability of the recent rally are valid - last week, gold fell sharply after setting a new high above $3,500/oz.
In summary, a normalization in the GSR could result from either a silver rally or a gold correction. While each path remains uncertain, a position focused on the ratio itself is relatively insulated from further divergence.
Given this environment, we could express our view in GSR through a long position in silver and a short position in gold. Investors can implement this using CME Micro Silver and Micro Gold futures. This setup benefits from 72% margin offsets. The Micro contracts balance the notional value between both legs by using one contract each.
A hypothetical trade setup consisting of a short position in CME Micro Gold futures expiring in June (MGCM2025) and a short position in CME Micro Silver futures expiring in June (SILM2025), offering a reward to risk ratio of 1.6x, is described below.
MARKET DATA
CME Real-time Market Data helps identify trading set-ups and express market views better. If you have futures in your trading portfolio, you can check out on CME Group data plans available that suit your trading needs tradingview.com/cme .
DISCLAIMER
This case study is for educational purposes only and does not constitute investment recommendations or advice. Nor are they used to promote any specific products, or services.
Trading or investment ideas cited here are for illustration only, as an integral part of a case study to demonstrate the fundamental concepts in risk management or trading under the market scenarios being discussed. Please read the FULL DISCLAIMER the link to which is provided in our profile description.

Gold Tesla4.28.25 In this video I talk about gold and Tesla. at the end of the video I suggested that there are times when the market isn't doing quite what your rules are but you have a feeling that the market is going to move in your favor... and in your opinion it's worth the risk even though you would not entirely be following your rules. the simple response would be that you're not following your roles at your decision is impulsive and that you shouldn't take that trade... but you believe that even if your trade breaks your rules you believe there's something in the pattern that tells you it's worth the risk you're willing to take. I'll tell you right now I did not upload this video until that bar completed... and I would have been stopped out of that trade because I would have gone short and the market went higher for a bit... but I realized something that I know about and I want to talk about that on a future video. to be clear I think the market is still going to go lower even though it would have taken out my short trade.... I'll talk about this tomorrow or the next day.... and by that time we'll see if the market really did go lower.

Gold | Short Bias | Liquidity Sweep Potential | (April 2025)Gold (XAUUSD) | Short Bias | Liquidity Sweep Potential + Structure Watch | (April 27, 2025)
1️⃣ Insight Summary:
Gold is at a critical level where multiple scenarios could unfold. Money flow and structure suggest a higher probability for lower prices, but a move higher toward $3,477 remains possible too.
2️⃣ Trade Parameters:
Bias: Short
Entry Zone: Watching for liquidity sweep around $3,225
Stop Loss: Above recent structure highs if the sweep setup fails
TP1: Partial profit near $3,225 (liquidity grab area)
TP2: Further downside depending on momentum and structure after the sweep
3️⃣ Key Notes:
✅ Money flow is exiting, and market structure leans toward lower prices for now.
✅ Heavy liquidity is resting around $3,225 — a sweep could trigger key reactions and partial exits.
✅ Still some possibility that Gold pushes higher toward $3,477 if market sentiment flips short-term bullish.
✅ Structure is not completely clean yet — waiting for a clearer setup before going heavy.
✅ Watch S&P 500 closely: a short-term correction there could help Gold move higher temporarily as a non-correlated asset.
❌ Risk if Gold breaks higher before sweeping $3,225, invalidating the current short-biased setup.
4️⃣ Follow-up:
I will continue monitoring Gold’s structure closely and will update the idea if we get a clean sweep or confirmation for the next move.
Please LIKE 👍, FOLLOW ✅, SHARE 🙌 and COMMENT ✍ if you enjoy this idea! Also share your ideas and charts in the comments section below! This is best way to keep it relevant, support us, keep the content here free and allow the idea to reach as many people as possible.
Disclaimer: This is not financial advice. Always conduct your own research. This content may include enhancements made using AI.

Gold trend directionGold 94032 has given a V Top reversal pattern which has neckline at 93986 and support at 91248.

Gold Analysis Using Price Action, COT & Fundamental IndicatorsI review Gold and how I'm looking to participate in this market going forward.


GOLD weekly outlook Part 2Explaining the scenarios. DO's and DONT's. Time windows. Back testing with Proper explanation and Timeframe Alignment

Will The Gold Rally End When Large Speculators Buy?A few weeks ago we reviewed Gold price action and positioning and how Large Speculators (blude column and traditionally trend followers) started to sell Gold which I could not explain. Well, they continued to sell Gold futures, and now Gold is breaking out making new all-time highs. If anyone knows who is buying this Gold, please comment and let me know, because it is not Hedge Funds trading with size (aka Large Specs). Small Specs (yellow column) have been buying but their size is so small, not sure that is what is driving price higher.
As Gold continues to be the commodity to watch in 2025, when will the market turn? As long as it is not crowded to the long side, the trend can continue for a while, especially if Large Specs continue to sell. I would keep watching to see when they start buying week over week (not just one week), where they commit to the trend, and hopefully they get max crowded, providing a potential short trade in Gold with high reward to risk ratio. Until then, and as I always say, don't short all-time highs.

Gold silver coffee4 15 25 I wanted to do this video before the market moved any higher today. I don't know if it's a paradox or not but it looks to me like gold is going to go higher today after it's been coiling since last week and I explained the Dynamics of a coil and the expansion of a coil and hopefully I said it clearly enough that you at least understand my point of view... and then whether it works or not it's a matter of what the market does and I can't change the market. so gold is near an all-time high and it looks like the buyers are coming in to take it higher but as it stands it's hard to know what's going on because it's early in the morning and nothing's really happening ... and my explanation would be that as bullish as the pattern is for gold to go higher it's still contracted. on the other hand silver is not contracted at all it is so expanded that there's a possibility that if silver starts going higher it can have very impressive moves because it's an expanded Market... and they move a lot better with a lot more efficiency than a contracted Market. and the Paradox is that the goal looks like it's going higher to a new high and the silver might go a lot higher because it's expanded. and I'm going to tell you right now if you read this none of it may happen ... but I would be very surprised if gold doesn't go higher... it only takes a few ticks. what really is going to be important to me... his if the silver actually trades the ABC pattern that I put on that chart because that pattern creates a very large Target area that can have tremendous effects on the silver market because it would be driven much closer to its all-time high which is $50.... so if silver goes several points higher there's a good chance it can attract more buyers to drive silver closer to its all time high..... in effect this changes the silver market which is lagging compared to the gold market.

Long trade
15min TF overview
Trade Overview: GC1! (Gold Futures) Long Position
Entry Price: 3468.9
Profit Target: 3509.6 (+1.17%)
Stop Loss: 3462.2 (–0.19%)
Risk-Reward Ratio: 6.07
Target Liquidity High: 3509.8
🕔 Entry Time: 5:05 AM
📅 Date: Tuesday, 22nd April 2025
🌍 Session: London AM
⏱ Entry Timeframe: 5-Minute TF
Trade Reasoning
Intraday Market Structure:
The 5-minute timeframe revealed a bullish internal break of structure, signalling a short-term reversal and favouring buy-side continuation. Price had formed a higher low, respecting bullish structure and suggesting accumulation.


Gold 97350 trend finally caughtWe are happy we could get the trend of gold finally. As we had posted yesterday though gold moved higher to 99358 intraday lost its gain 2000 and finally closed below the resistance 98582 we had mentioned.
Today we expect Gold close would be below 98073 and more possibility to get corrected to test the imbalance at 90910.
------------------------------------------------------------------------------------------------------------------
yesterday we posted in
Our analysis about gold was going wrong and wrong again and it is moving higher and higher.
After careful study and applying *new TA concepts * we have come to a conclusion it would be 98582 which would be its climax resistance on close basis and would get corrected.

gold 3265 long, stop of 3230, profit of 4.6% at 3416When gold reaches 3265, I open a long position with a stop of 3230, a profit of 4.6% at 3416

Gold will continue to break out!Looking for the bullish price action to continue as we get ready to close the week and next week close the month. Watching for support as we move into the killzones. Excess has been created on the DOM and it should continue from here.
