Goldman Says $4K – My Chart Says Sell💥📉 Gold Analysis – Divergences, Resistance, and a Short Bias 🪙⚠️
Hey Traders,
As promised in the latest video, here's the official chart update for Gold – and the message is clear: I'm short.
📊 What I See on the Chart
We're now well below the 3,446 resistance, with early signs of weakness showing up across multiple timeframes. I’ve laid out both the 2-Day and 4H charts in this post, and here’s what I’m tracking:
⚠️ Technical Warning Signs:
🔻 2D chart: Six bearish divergences
– RSI, Stochastic, CCI, OBV, MFI, and MACD all flashing red
📉 1D chart: Same thing — six divergences, telling me momentum is fading
⏳ 4H chart: Price action breaking trendlines, and support at 3,237 looks shaky
🚨 If that breaks, my main support zone is at $3,000 – and that’s where I believe we’re heading.
This is not just a pullback. This is the kind of confluence you can’t ignore if you trade technically.
🔁 Sentiment Shift
Back in December '22 and again earlier this year, I was long Gold – and it was the right call. But now?
📌 This chart has gone from momentum to exhaustion.
📌 I see less demand, softer momentum, and strong bearish divergence stacking across every major timeframe I watch.
🎯 Trade View
✅ I’m short Gold.
🎯 Targeting the $3,000–3,050 zone.
📉 Invalidated if we reclaim and close above $3,446 with strength.
It’s that simple. Nothing personal – just structure, divergence, and flow.
🧠 The Chart vs. The Narrative
Recently, I saw a note from Goldman Sachs forecasting $4,000 Gold. Maybe they’re right.
But I’ll be honest with you – I don’t buy the media hype.
I'm not here for the headlines.
I'm a chart guy. Always have been. Always will be.
The chart is the map to the treasure – and that’s the only thing I follow.
🧠 I cover this and the broader macro setup (Dollar, BTC, DAX, Tech, BTC.D, and more) in the full 20-min video just dropped. If you haven’t watched it yet, go catch up — it explains the logic and why this isn’t just a gold story.
One Love,
The FXPROFESSOR 💙
Disclosure: I am happy to be part of the Trade Nation's Influencer program and receive a monthly fee for using their TradingView charts in my analysis. Awesome broker, where the trader really comes first! 🌟🤝📈
Gold Petal Futures
GOLDPETALV2025 trade ideas

Bearish Rejection from SupplyDuring the NY session open, Gold (GC1!) broke above the 30-min ORB high at 3335.8, briefly entering a known supply zone (3342–3345). The move lacked follow-through and immediately reversed — signalling a liquidity sweep and classic NY session trap setup.
This invalidates the bullish breakout and supports a short-biased play back toward the ORB low and into deeper demand.
Trade Details:
Entry: 3336.0 (short after failed breakout + rejection candle)
Stop Loss: 3342.0 (above the supply zone high)
Take Profit 1: 3327.1 (ORB low)
Take Profit 2: 3320.0 (prior demand zone)
Take Profit 3 (optional): 3315.0 (liquidity void fill)
Risk:Reward: ~1:1.3 to TP1, ~1:2.2 to TP2
Position Type: Short
Execution Time Frame: 5-min/15-min
Model Tags: Liquidity Sweep, NY Session Fade, Supply Rejection
🔍 Quant Notes:
Price action exhibited a false breakout — NY session opened with an expansion move above ORB high, which was immediately rejected.
Re-entry into the ORB range confirms buyer exhaustion and makes a move back to the ORB low highly probable.
Bearish bias is reinforced by multiple upper wicks, supply zone rejection, and failed structure reclaim.
Key Confirmation:
Bearish engulfing or strong close back below 3335
Failure to reclaim EMAs or trend line
Momentum shift on 5-min with volume divergence
Closing Thoughts:
A failed ORB breakout into supply during NY open is a classic trap — and today’s price action on GC1! fits the model. This short setup targets the full ORB range retrace with potential continuation if sellers hold control.

Shorting gold again Well, it does look like there is still some room for a short trade that might actually hit.
Personally, iam not 100% confident in this trade, but i would have liked to see more confirmations before taking the short entry, yet still i think it is still worth the risk.
if you want more confirmations then here is the thing, wait the price to close below this yellow line, and i mean a close not a wick, then wait the price to pullback and take a short position.
my confidence in this setup is 6 out of 10.

GoldI am the best Trader in the World !
Even if other many professional traders says that Gold will go up , I am here to tell you No ! the Gold will very soon Collapse more than 11% !


Retail trapped. Volume confirmed. Liquidity targeted.🔻 We are in a highly reactive zone where emotional long entries and early short SLs create perfect liquidity magnets.
🔍 Key Levels & Zones:
• Early Short SL Zone → 3337.2
• Retail FOMO Entry Block → 3251.9
• Volume-based Rejection Point → 3392.0 (SL/TP sweep)
• TP1 & TP2 Zones → 3251.9 / 3208.0
• Bonus TP → 3159.9 → Complete sweep of long SLs and demand exhaustion
• Final Trap Exit Zone → 3157.4 — Institutional reload zone
💡 Volume confirms this cycle of:
• Trap > SL hunt > Emotional entry > Volume fade > Dump > Accumulation > Reversal
🧠 This is NOT financial advice. I post to share deeper insight into manipulation mechanics & sniper-level liquidity structure analysis.
If you’re still trading candles, you’re playing retail games. Start seeing the architecture.
🧷#XAUUSD #SmartMoney #LiquiditySweep #VolumeStrategy #TradingPsychology #RetailTrap #SniperMindset

Gold LongsFollowing last weeks bias. Looking for REQH target.
Want to pair longs with a weekly profile. Ideally Monday or Tuesday creates the low of week. Will look to get onside with longs once theres a clear intraweek reversal. Trade the continuation higher. A close below 3320 is invalidation. Expecting previous week low to be protected and expansion to the upside


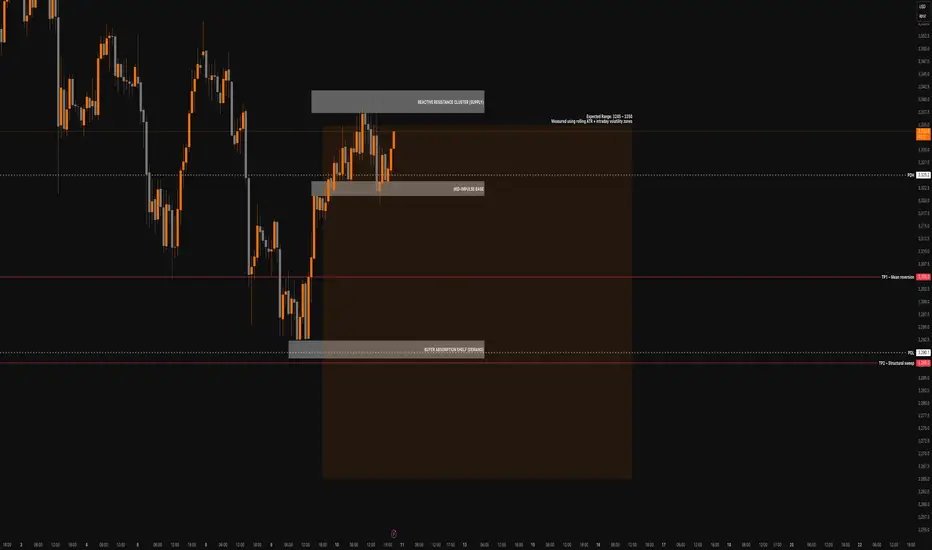
Gold Futures Short Bias Into NY CloseGC is stalling beneath the 3330–3336 resistance cluster after failing to break out during NY session. Price rejected the fair value gap (3312–3318) and is now compressing just above the mean-reversion anchor (LWN). There’s no momentum reclaim from buyers, and structure suggests weakness into Friday.
We’re positioning short into expected downside continuation.
Key Levels
Reactive Resistance Cluster: 3330–3336
FVG (rejected): 3312–3318
Mean-Reversion Anchor (LWN): 3290–3300
Absorption Shelf (Target Zone): 3275
PDH/PDL (provisional): 3325 / 3280
VWAP: Flattened, near 3302
Short Setup (Active)
Entry: 3332
Stop: 3340
TP1: 3305 – Mean reversion
TP2: 3288 – LWN sweep
TP3: 3275 – Absorption shelf
Staakd Setup: 1:5.7 R:R to final target
Bias confirmed by rejection from inefficiency and absence of buyer follow-through
QM Probabilities
Bear Move 60–65% Structure favoUrs continued rejection + flush to 3275
Bull Move 35–40% Requires reclaim of 3318 + aggressive close above VWAP
Range/Flat Possible pre-close Tight range unless displaced overnight
Staakd Bias:
Structure is holding beneath resistance. Without a reclaim of 3318, we remain short-biased into Friday with eyes on 3275. Probability favours continuation unless buyers reclaim initiative fast.
Follow for post-close recap and updated levels ahead of Friday's NY open and we hope your trades worked out how you expected today.
Gold Trade Setup – Long Invalidated, Watching Retest for ShortGold has been consolidating between $3,200 and $3,500, recently pressing against a descending resistance line that has rejected price several times. I was favoring the upside, but our long setup was invalidated — the stop loss at $3,330 was hit.
Price is now retesting ascending support, and I'm shifting focus to a short opportunity, using our previous long entry level (~$3,333) as a key area of interest for entries.
Here’s the updated plan:
Short Entry: Around $3,333
Stop Loss: $3,340
Take Profit: $3,303
Remaining cautious but opportunistic — the larger structure is vulnerable and could break further if support fails.

Gold. The plan for the next few days.The nearest resistance zones are where it's interesting to look for purchases. We are waiting for a reaction and looking for an entry point.
The post will be adjusted if there are any changes.
Don't forget to click on the Rocket! =)

Gold Short Source, Trust me bro.
I mean well its in a downtrend and the price just keeps hitting lower, the 4h reacting very bearishly and the 1 day also didnt say much more than daily downtrend (recently).
So i think i have good confidence in this trade as i took the long pullback trade yesterday and the price showed that its respecting my analysis, so i would assume this will work out.

Mixed market for GOLDHard to frame an idea for gold because the dxy looks strong and gold looks strong as well, indicating to me a mixed market. Sitting on the sidelines for gold is probably the better bet right now because we just had a sweep of buyside liquidty and tapped back into a daily fvg. Notice the candles, and how they didnt close above the swing high. So because gold looks bullish and dxy looks bullish, im not interested in gold for tuesday trading. But if i had to pikc, we continue up for gold and attacck that buyside/ eqaul highs

Gold will continue with its bullish breakoutLooking for new highs to be made. Price has pushed bullish as trump started talking about the tariffs early today. Even though they are not supposed to discuss till the 9th. We can get a early move for the week. Monitoring the price action to see if I can get in where I fit in!

New Week on Gold! Will the Bullishness continue?I was bullish on gold and price ended up doing as expected last week and looking for it to continue this week. But i have to sit on hands for now to see how they want to play Monday. Will they move to create a Low for the week first? or will they break out to start early on new highs? I have to see some type of confirmation first. Then we can get active.

July 4 GOLD FIREWORKS!!!Gold bout to POP!!!! and it could be seriously huge! Im just patiently waiting for a area of entry. I have never traded a July 4th Holiday with this much clarity on what I see so this could get interesting.

Will The new Week kick off more bullish Pressure for GOLD?looking for more bullish activity this week but need to sit on my hands for now to see if they establish a Low for the week first. Once we see that and start to see HH's made then we can consider a entry to get in on the move. I cant rush it though. Have to be patient.

Gold Futures (GC1!) – Accumulation Brewing? Major Move IncomingGold has been stuck in a tight range since April, and to me, this looks like a textbook accumulation zone forming on the daily chart.
Price is coiling within a defined box, showing signs of both strength and weakness — classic behavior before a manipulative move (fake breakout) followed by distribution (true direction). This is where many traders get trapped, chasing the first breakout — only to get caught before the actual move begins.
I’m not committed to a direction yet, but here’s my roadmap:
🧠 First breakout = likely trap (manipulation)
🧭 Wait for confirmation of rejection/failure, then prepare for the real move out of the range
This kind of price behavior often precedes explosive volatility, so I’m watching closely for:
False breakouts above or below the box
Volume spikes or traps
Shift in market structure on lower timeframes
📍 No trade for now, but I’ll be reacting — not predicting.
What’s your bias? Do you think the breakout will hold or fake out?

GOLD TRADING IDEA FOR 14-18 JULY 2025The price of Gold currently at the H4 liquidity control area at 3376. It's seem like there candlestick H4 rejection at that area but still not valid for market structure shift direction.
If the candlestick breakout above at H4 liquidity control ,I will looking opportunity for long position with target at next H4 liquidity control at 3390 or extension target at 3410.
short term SELL
Price retracement before the price going up.
If small timeframe show market structure shift or develop bearish engulfing pattern at H1 0r m30 below 3376 . The target will be h4 liquidity control at 3354 or 3320 depend on how price act at that area.

Shoring GoldSo here we go again with gold.
there are two theories at this point, a bullish case and a bearish case.
The bullish case that the price broke a bearish trend and moving upwards.
For a bearish case, the price didn't close that strong above the last swing. Also the whole structure is bearish so this last up move could be very well a trap for buyers.
On the 4h tf, there is an FVG, bearish one that the price so far is reacting to.
So Even though there is a strong up move, i still lean bearish.
Later today once i get a confirmation, i will update the idea.
I might be very wrong on this trade, my confidence in this trade is 4 out of 10. So Use smaller size position.
Also iam expecting the price to revisit 3320 USD

Extremely bullish on gold I am long Gold, 1hr breaker after attacking sellside mutiple times, dxy is correcting right now as well. its wednesday so we could see mid week reversal, we also have equal highs. We are also inversing a 1hr fvg (RED) which adds confluence with the breaker. solid setup, invalidation is 3303 and tp is 3372.

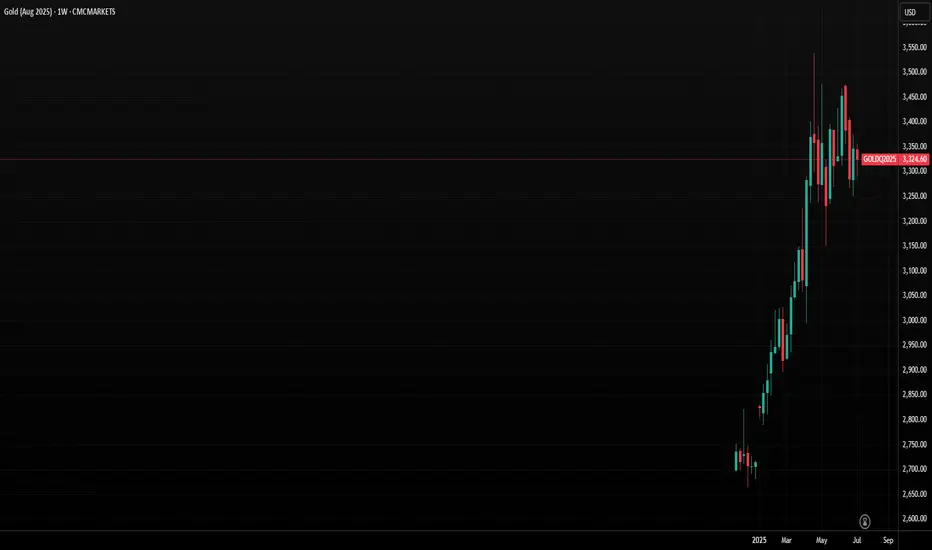
Gold at Critical Juncture as Bearish Momentum GrowsGold is showing signs of breaking down as the US dollar recovers from a steep decline. Gold and the dollar typically have an inverse relationship over the longer term. The precious metal has been trading sideways since April, but more importantly, it has been trending lower since mid-June. Gold is now approaching a critical juncture, testing an uptrend established in mid-May. Although it has previously held this support level, gold appears likely to break lower this time.
The Trend Lower Is Strengthening
The Relative Strength Index (RSI) is now trending steadily lower, forming a series of lower highs. This suggests that gold’s momentum is currently bearish, indicating potential for continued weakness in the days ahead. To reverse this bearish momentum and shift to a bullish outlook, the RSI would need to rise firmly above 50.
More significantly, gold is now very close to breaking a significant uptrend at $3,300, which was previously tested on June 27 and June 30. On both occasions, the price dipped intraday below this trendline but managed to close above it. The trendline was retested on 8 July, initially holding, but gold is dipping below this critical support level again on 9 July. A close below the trendline on July 9, followed by continued declines starting on July 10, would confirm that the uptrend has broken. This breakdown would signal further downside risk, with initial support at $3,230, followed by $3,170.
Triple Top
Perhaps even more crucially, a triple-top pattern established at the $3,400 becomes increasingly likely each time gold trends lower. The $3,170 support level is particularly significant because it forms the neckline of this triple-top pattern. A decisive break below $3,170 would confirm the triple top pattern and indicate a deeper decline, potentially targeting the range between $2,950 and $3,000.
Written by Michael J. Kramer, founder of Mott Capital Management.
Disclaimer: CMC Markets is an execution-only service provider. The material (whether or not it states any opinions) is for general information purposes only and does not take into account your personal circumstances or objectives. Nothing in this material is (or should be considered to be) financial, investment or other advice on which reliance should be placed.
No opinion given in the material constitutes a recommendation by CMC Markets or the author that any particular investment, security, transaction, or investment strategy is suitable for any specific person. The material has not been prepared in accordance with legal requirements designed to promote the independence of investment research. Although we are not specifically prevented from dealing before providing this material, we do not seek to take advantage of the material prior to its dissemination.
Ethereum vs. Gold Chart Comparison – Potential Explosive The comparison between Micro Gold Futures (MGC1!) and Ethereum (ETHUSDT) on the weekly timeframe suggests that Ethereum could be mirroring gold’s price structure before its parabolic breakout.
Key Similarities Between Gold & Ethereum:
Impulse Leg Formation 🔥
Both assets formed a strong impulse leg after a significant low.
The Ethereum impulse leg started from the ~$1,530 low, pushing toward ~$4,000 before retracing into accumulation.
Gold followed a similar pattern, forming a strong rally before consolidation.
Accumulation Range
Both charts show a clear accumulation phase after the impulse leg.
Gold accumulated sideways for an extended period before exploding to the upside.
Ethereum is currently within its accumulation range, suggesting that it could be preparing for a similar breakout.
This is a shakeout phase designed to trap weak hands before the real move.
Standard Deviation Extensions (STDVN) & Key Levels 🎯
Both charts use standard deviation extensions (STDVN) to project potential short-term targets.
0.5 STDVN & 1 STDVN levels are crucial areas where price could react.
Gold blasted through these levels after breaking out of accumulation.
If Ethereum follows suit, 5,288 (0.5 STDVN) and 6,605 (1 STDVN) could be in play.
Previous Highs Acting as Support/Resistance
Gold broke past its old high, retested, and surged.
Ethereum is still hovering below its previous major high (~4,800).
If Ethereum flips this level into support, it could send price into price discovery mode.
What This Means for Ethereum 🚀
Gold already showed the path—Ethereum is lagging but setting up similarly.
Volatility is part of the process—shakeouts happen before the breakout.
Holding ETH through this phase could be crucial if history repeats itself.
A breakout beyond the accumulation range could send ETH towards $5,200 - $6,600+ in the short term.
Beyond 1 STDVN, ETH enters uncharted territory—an all-time high breakout could be explosive.
Final Thoughts from Lord MEDZ 👑
Not financial advice, but I’m holding ETH through the chop. The last shakeout before an all-time high run is often the toughest. But the chart comparison is clear: Gold did it first. Ethereum could be next.
🔥 Patience. Conviction. Execution. 🔥
