NATGAS Long setupIf you like my Idea, Don't forget to Boost and comment on my Analysis. The recommendations are purely for educational purpose only, consult you financial advisor before trading.
Natural Gas Futures
NATURALGAS1! trade ideas

Natural Gas | Oil | Dollar | Silver | Gold Price Forecast.Natural Gas | Oil | Dollar | Silver | Gold Price Forecast.
NYMEX:NG1! NYMEX:CL1! COMEX:GC1! COMEX:SI1!

NATGAS: Expecting Bullish Movement! Here is Why:
Remember that we can not, and should not impose our will on the market but rather listen to its whims and make profit by following it. And thus shall be done today on the NATGAS pair which is likely to be pushed up by the bulls so we will buy!
Disclosure: I am part of Trade Nation's Influencer program and receive a monthly fee for using their TradingView charts in my analysis.
❤️ Please, support our work with like & comment! ❤️

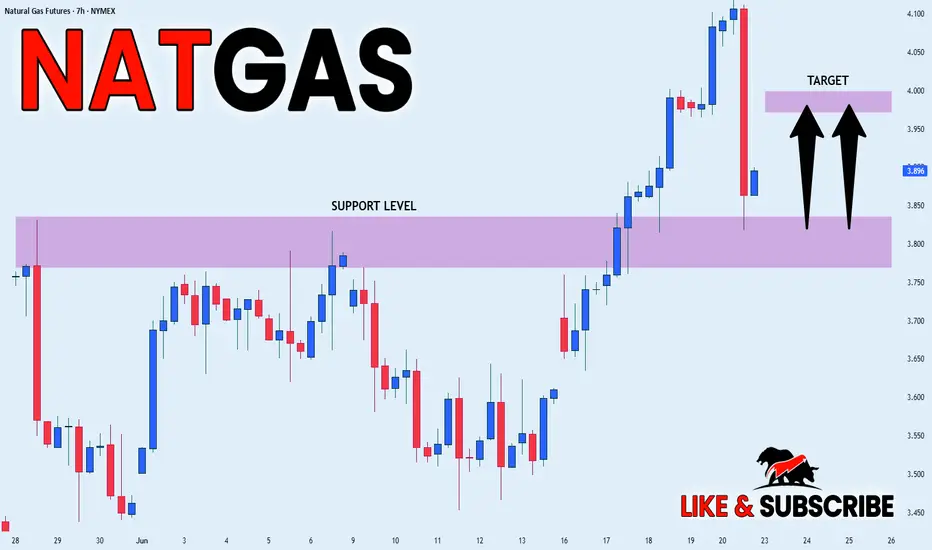
NATGAS REBOUND AHEAD|LONG|
✅NATGAS went down to retest
A horizontal support of 3.820$
Which makes me locally bullish biased
And I think that a move up
From the level is to be expected
Towards the target above at 3.984$
LONG🚀
✅Like and subscribe to never miss a new idea!✅
Disclosure: I am part of Trade Nation's Influencer program and receive a monthly fee for using their TradingView charts in my analysis.
NG1!: Bulls Are Winning! Long!
My dear friends,
Today we will analyse NG1! together☺️
The market is at an inflection zone and price has now reached an area around 3.894 where previous reversals or breakouts have occurred.And a price reaction that we are seeing on multiple timeframes here could signal the next move up so we can enter on confirmation, and target the next key level of 3.993.Stop-loss is recommended beyond the inflection zone.
❤️Sending you lots of Love and Hugs❤️

NaturalGas 3rd wave about to comeNaturalgas Making a 2nd wave on 4h Chart. It has also made a 2nd wave on Daily chart. Possible 3rd of 3rd on Monday.
Daily Chart:
Hourly Chart
15 Min Chart
NATGAS Long From Support! Buy!
Hello,Traders!
NATGAS made a great
Bearish correction and
And then retested a
Horizontal support
Around 3.800$ from where
We are already seeing a
Bullish rebound so we
Are bullish biased and we
Will be expecting a
Further bullish move up
Buy!
Comment and subscribe to help us grow!
Check out other forecasts below too!
Disclosure: I am part of Trade Nation's Influencer program and receive a monthly fee for using their TradingView charts in my analysis.

Will Middle East Flames Ignite Winter Gas Prices?The global natural gas market is currently navigating a period of profound volatility, with prices surging and defying typical seasonal trends. This significant upward movement is primarily driven by escalating geopolitical tensions in the Middle East, specifically the intensifying conflict between Iran and Israel, coupled with the looming potential for direct US military intervention. This complex interplay of factors is fundamentally reshaping perceptions of global energy supply and influencing investor sentiment, pushing natural gas prices towards critical psychological and technical thresholds.
Direct military strikes on Iran's energy infrastructure, including the world's largest gas field, the South Pars, have introduced a tangible threat to supply at the source. This is compounded by the strategic vulnerability of the Strait of Hormuz, a vital maritime chokepoint through which a significant portion of the world's liquefied natural gas (LNG) transits. Despite Iran possessing the world's second-largest natural gas reserves and being the third-largest producer, international sanctions and high domestic consumption severely limit its export capabilities, making its existing, albeit modest, export volumes disproportionately sensitive to disruption.
Europe, having strategically pivoted to LNG imports following the reduction of Russian pipeline gas, finds its energy security increasingly tied to the stability of Middle Eastern supply routes. A prolonged conflict, especially one extending into the crucial winter months, would necessitate substantial LNG volumes to meet storage targets, intensifying competition and potentially driving European gas prices higher. This environment of heightened risk and volatility also attracts speculative trading, which can amplify price movements beyond fundamental supply-demand dynamics, embedding a significant geopolitical risk premium into current market valuations.
This confluence of direct infrastructure threats, critical chokepoint risks, and Europe's structural reliance on global LNG flows creates a highly sensitive market. The trajectory of natural gas prices remains inextricably linked to geopolitical developments, with potential for further substantial increases in an escalation scenario, or sharp reversals should de-escalation occur. Navigating this landscape requires a keen understanding of both energy fundamentals and the intricate, often unpredictable, currents of international relations.

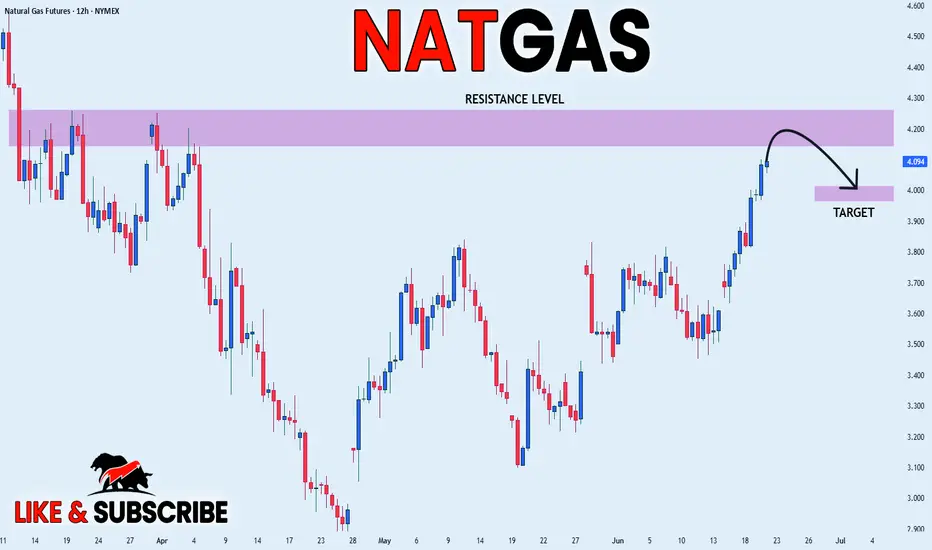
NATGAS STRONG RESISTANCE AHEAD|SHORT|
✅NATGAS has been growing recently
And Gas seems locally overbought
So as the pair is approaching
A horizontal resistance of 4.256$
Price decline is to be expected
SHORT🔥
✅Like and subscribe to never miss a new idea!✅
Disclosure: I am part of Trade Nation's Influencer program and receive a monthly fee for using their TradingView charts in my analysis.
Bullish Trend Remains IntactNatural Gas has been trading inside this rising channel for just over 2 years now. Tested the bottom of this channel for most of this year, now it’s looking to go back up to the top of the channel once again. I would stay long until it hits the top of the channel, unless it closes above the top of the channel on a weekly basis in which case that would be very bullish and I would stay long.

Natural Gas | Oil | Dollar | Silver | Gold Price Forecast.Natural Gas | Oil | Dollar | Silver | Gold Price Forecast.
COMEX:SI1! COMEX:GC1! NYMEX:CL1! AMEX:UNG

NATGAS: Market of Sellers
Balance of buyers and sellers on the NATGAS pair, that is best felt when all the timeframes are analyzed properly is shifting in favor of the sellers, therefore is it only natural that we go short on the pair.
Disclosure: I am part of Trade Nation's Influencer program and receive a monthly fee for using their TradingView charts in my analysis.
❤️ Please, support our work with like & comment! ❤️

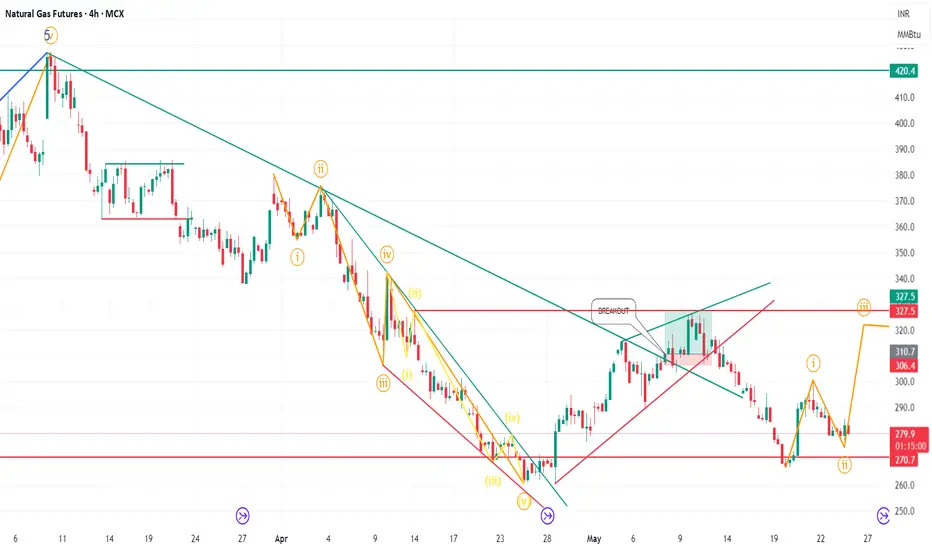
Naturalgas long tradeNaturalgas is resisting downside movement as witnessed on chart.
If you see the downward movement of Naturalgas, it is with relatively high volume but it is not coming down as expected from sellers and bouncing back up again as seen 3 times.
Now naturalgas has reached short term resistance zone of 307-310 from which it took support on 9th June, broke it on 10th June, took resistance on 11th and 12th June.
This might be a Change of Character zone for Naturalgas.
And now that Naturalgas is resisting downward movement, we might see breakout of this zone and probable upside movement.
Lastly it is also forming Ascending triangle which is still premature but just for reader's consideration.
Let's watch it on coming days.

NATGAS Growth Ahead! Buy!
Hello,Traders!
NATGAS made a retest of
The horizontal support level
Of 3.450$ then established
A double bottom pattern
And a we are already
Seeing some rebound so
We are locally bullish biased
And we will be expecting a
Further bullish move up
On Monday
Buy!
Comment and subscribe to help us grow!
Check out other forecasts below too!
Disclosure: I am part of Trade Nation's Influencer program and receive a monthly fee for using their TradingView charts in my analysis.

NG1!: Target Is Down! Short!
My dear friends,
Today we will analyse NG1! together☺️
The price is near a wide key level
and the pair is approaching a significant decision level of 3.602 Therefore, a strong bearish reaction here could determine the next move down.We will watch for a confirmation candle, and then target the next key level of 3.569..Recommend Stop-loss is beyond the current level.
❤️Sending you lots of Love and Hugs❤️

NATGAS Technical Analysis! SELL!
My dear followers,
This is my opinion on the NATGAS next move:
The asset is approaching an important pivot point 3.610
Bias - Bearish
Technical Indicators: Supper Trend generates a clear short signal while Pivot Point HL is currently determining the overall Bearish trend of the market.
Goal - 3.558
About Used Indicators:
For more efficient signals, super-trend is used in combination with other indicators like Pivot Points.
Disclosure: I am part of Trade Nation's Influencer program and receive a monthly fee for using their TradingView charts in my analysis.
———————————
WISH YOU ALL LUCK

NG1! BEARS ARE STRONG HERE|SHORT
NG1! SIGNAL
Trade Direction: short
Entry Level: 3.609
Target Level: 3.451
Stop Loss: 3.714
RISK PROFILE
Risk level: medium
Suggested risk: 1%
Timeframe: 4h
Disclosure: I am part of Trade Nation's Influencer program and receive a monthly fee for using their TradingView charts in my analysis.
✅LIKE AND COMMENT MY IDEAS✅

NATURAL GAS NEAR AT RESITANCE !!This is the 4 hour chart of NaturalGas1!.
Natural Gas is trading near the resistance of an ascending triangle pattern at 325-332 range.
If this level is sustain,we may see pattern support at 285-290 range
If Natural Gas breaks out above the resistance, it may lead to a new high with a potential upside of 33-34% return, targeting the upper boundary of the channel.
If it gives a breakdown, it may form a new low with further downside potential.

NATGAS My Opinion! SELL!
My dear subscribers,
This is my opinion on the NATGAS next move:
The instrument tests an important psychological level 3.785
Bias - Bearish
Technical Indicators: Supper Trend gives a precise Bearish signal, while Pivot Point HL predicts price changes and potential reversals in the market.
Target - 3.588
My Stop Loss - 3.901
About Used Indicators:
On the subsequent day, trading above the pivot point is thought to indicate ongoing bullish sentiment, while trading below the pivot point indicates bearish sentiment.
Disclosure: I am part of Trade Nation's Influencer program and receive a monthly fee for using their TradingView charts in my analysis.
———————————
WISH YOU ALL LUCK

NG1! BEST PLACE TO SELL FROM|SHORT
NG1! SIGNAL
Trade Direction: short
Entry Level: 3.786
Target Level: 3.590
Stop Loss: 3.916
RISK PROFILE
Risk level: medium
Suggested risk: 1%
Timeframe: 9h
Disclosure: I am part of Trade Nation's Influencer program and receive a monthly fee for using their TradingView charts in my analysis.
✅LIKE AND COMMENT MY IDEAS✅

Natural Gas | Oil | Dollar | Silver | Gold Price Forecast.Natural Gas | Oil | Dollar | Silver | Gold Price Forecast.
OANDA:XAGUSD COMEX:SI1! NYMEX:NG1! COMEX:GC1!

NATGAS: Bearish Continuation & Short Trade
NATGAS
- Classic bearish formation
- Our team expects fall
SUGGESTED TRADE:
Swing Trade
Sell NATGAS
Entry Level - 3.785
Sl - 3.918
Tp - 3.532
Our Risk - 1%
Start protection of your profits from lower levels
Disclosure: I am part of Trade Nation's Influencer program and receive a monthly fee for using their TradingView charts in my analysis.
❤️ Please, support our work with like & comment! ❤️

NG1!: Bears Are Winning! Short!
My dear friends,
Today we will analyse NG1! together☺️
The in-trend continuation seems likely as the current long-term trend appears to be strong, and price is holding below a key level of 3.775 So a bearish continuation seems plausible, targeting the next low. We should enter on confirmation, and place a stop-loss beyond the recent swing level.
❤️Sending you lots of Love and Hugs❤️
