Silver Futures
SILVER1! trade ideas

Silver ready to fly :)Silver is forming bullish pattern !!!! I am expecting a huge movement in coming days !!!


Silver monthly (+silver vs gold)NO confirmation yet on monthly chart for silver's much anticipated breakout.
Note, silver will most likely breakout on its own chart merit, a few months BEFORE it breaks out versus gold.
That is what it has done the PREVIOUS 6 times since the early 2000s.
#silver #gold OANDA:XAGUSD OANDA:XAUUSD

LONG Silver positive mfi divergenceSilver showing consolidation around 75000. and although in overbought zone it is showing positive mfi divergence in daily time frame.
One can enter in long position at 74830-74950 for a target of 76000+
stoploss 74700.

Silver Fails At Top of Range . . . Now what?Silver: Daily Fibs and Indicators: Silver has a bull fib objective that takes it to 28.86, a massive move. It held it's 61.8% line in October 23 and was on it's way until December 23 when it stopped at the high of it's daily range. We traded down early in the year, only to test that high again htis past week. And, we are selling off of it again. We can't trust gold to go higher if Silver doesn't make a new high here. Silver lost it's embedded reading of the past 4 days. Big test for silver is 24.21, the BB midpoint, and the bull fibs from lows. that 23.55 level was resistance and the fact that it's the 61.8% line and support could be very key to support here. IMO, that would be a good place be a buyer for silver.

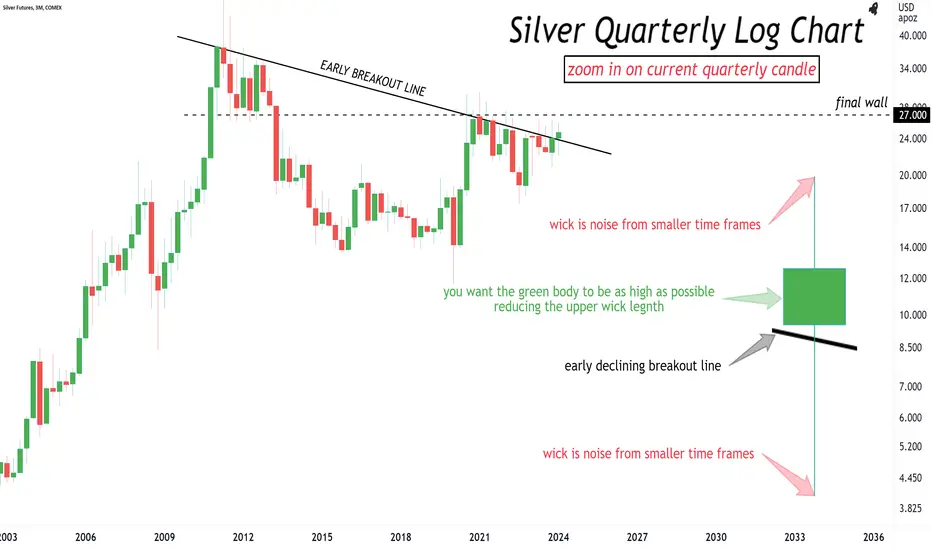
silver quarterlyQuarterly candles can give VERY POWERFUL signals.
5 trading days left for #SILVER to regain a CONVINCING breakout posture...
Silver Complete the Downside CycleAfter long Downside target done now next move possible for the Silver upside if sustain above 71672
stoploss 69137 possible target 72500-74000-75500-77500

Short Silver on COT Force PushThe markets are really all about finding patterns and taking advantage of such forcefully. With Silver, the commercial producers and bullion banks tend to exert the most amount of market influence upon its price. The reason is that Silver is primarily an industrial metal sensitive to economic demands and also due to the fact that unlike gold, it is primarily mined as a by-product through the mining of other metals such as copper, iron, aluminum, etc.
If one can recognize the behavior of Silver once the commercial entities are starting to sell in larger then usual amounts, we can catch the downside action just as it starts to occur. In addition, the price action through the evident "force push" when the price is forced to a quick swing high and abruptly u-turned tends to signal that a price reversal is being confirmed. Today we have witnessed such event take place and we are now getting in position for an estimated $3+ decline in the price of silver in the coming weeks.

TSLE DXY OIL SILVER3.19.24 This video is a review of tesla, dxy, oil, and silver. It's all about using a handful of tools to help you decide where the markets are going to reverse and whether or not you should be taking profits or entering markets as a buyer or a seller with a high probability that the market will at least trade in your direction for a while... using a small stop. About a year or so when the markets were reaching or highs and starting to move lower I stated that bear markets ultimately become much more difficult to trade because they contrast. In the beginning part of this market reversal to go lower from the highs it was very easy to spot reversal patterns on the equity markets and also on the indexes because the markets had lots of volatility and range.But when you look at the markets that I'm showing you today... you can see that they're not as easy as they could be, But if you're patient and you wait for the setups using the tools we use you can find opportunities especially if you're willing to scalp... looking for nice reversal patterns and being willing to get in and out of the market. for the most part these are not buy and hold markets in my opinion. also, the metals are going higher and I don't think they're particularly easy to trade... but they are tradable if you're selective. I don't think day trading Tesla is a good way to go for many reasons including the fact that it's a equity market and it's hundreds of dollars a share and there are penalties if you have a losing trade in equities markets when it comes to tax liability and wash rules. if you own equities markets and you're willing and able to use opsins, that might be an option.

The Break-Out We Are Waiting For? Silver has been trading within a wedge for about four years. As we approach the upper end of the resistance range, many traders are wondering if this can be the breakout that we have been waiting for.
What is behind this move?
There are a few potential catalysts that can explain the recent price action observed in March. Silver, similar to Gold, and BTC have seen a “decoupling” of fundamentals. Typically, all of these risk assets are very sensitive to the interest rate environment and macroeconomic momentum. Inflation in the U.S., as observed through CPI and PPI, has recently come in hotter than expected, interest rate cut expectations have been reduced, and the 10-year yield is higher. However, silver prices are also higher.
This could be attributed to an “underpositioning” in commodities. Investment advisors and portfolio managers have begun to add commodities into portfolios, increasing the weighting of real assets. This could also be due to ETF inflows picking up for these metals in March.
China smelters collectively came together and decided to cut production output of copper. Since silver and copper are both used in many industrial applications, this production cut in copper has also boosted silver prices.
Despite recent increases in CPI and PPI, we have observed some softening in the labor market. The uptick in the Unemployment Rate, weaker Average Hourly Earnings, and the massive downward revision to Nonfarm payrolls may be aiding this rally, despite higher yields.
Technicals:
From a technical perspective, if silver can manage to break and close above 25.75, we could see a new bull cycle in the precious and industrial metal.
Check out CME Group real-time data plans available on TradingView here: www.tradingview.com
Disclaimers:
CME Real-time Market Data help identify trading set-ups and express my market views. If you have futures in your trading portfolio, you can check out on CME Group data plans available that suit your trading needs www.tradingview.com
*Trade ideas cited above are for illustration only, as an integral part of a case study to demonstrate the fundamental concepts in risk management under the market scenarios being discussed. They shall not be construed as investment recommendations or advice. Nor are they used to promote any specific products, or services.
Futures trading involves substantial risk of loss and may not be suitable for all investors. Trading advice is based on information taken from trade and statistical services and other sources Blue Line Futures, LLC believes are reliable. We do not guarantee that such information is accurate or complete and it should not be relied upon as such. Trading advice reflects our good faith judgment at a specific time and is subject to change without notice. There is no guarantee that the advice we give will result in profitable trades. All trading decisions will be made by the account holder. Past performance is not necessarily indicative of future results.

Very rare silver chart setup quarterlyA very rare chart setup for silver is playing out right now (only 3rd time in 50 years).
10 more trading days to confirm silver's quarterly defined breakout... Hang on tight!
#silver #gold OANDA:XAGUSD OANDA:XAUUSD

SILVER LOOKING EXTREME BULLISHConsidering to the technical analysis silver is looking good for a good up move . A deep consolidation on the higher time frame and on the higher levels . We can go long for longer time frame with given SL and Targets on the charts .

SILVER - The Gold substitute.🎯The chart is pretty self-explanatory as always!
🎯If I were you, I would keep an eye on this shiny metal.
🎯 With increasing turmoil over the globe, Precious metals are becoming lucrative.
🎯 Beautiful consolidation structures
Share your thoughts below!
⚠️Disclaimer: We are not registered advisors. The views expressed here are merely personal opinions. Irrespective of the language used, Nothing mentioned here should be considered as advice or recommendation. Please consult with your financial advisors before making any investment decisions. Like everybody else, we too can be wrong at times ✌🏻

Short SILVERIf the candle (1 day) closes below the last one, I believe it will go down.
Hit me up if you agree with me

SLV: Showing signs for a move to $50Silver is getting ready for a move to $50 levels. The momentum will pick up once the down-sloping channel is broken. A trade can be taken now with a stop loss at 20.45.
Gold has already broken out, silver looks ready to follow. Indicators also imply the same thing:
1. MACD moving average is rising, and is now up above the zero line
2. RSI is above its RSI Moving Average
3. ADX will give a confirmation at the break of down sloping channel.

Silver 2 Year Wedge Breakout Looming?Silver is at a critical point in it's chart. With gold breaking to new highs, Silver has underperformed but has rallied alongside the yellow metal. Now we are at a critical stage that can see silver breakout of its flag and continue it's bull trend. The indicator that I love to look for longer-duration breakouts is the slow stochastics, specifically, when it becomes embedded or stuck on one side or the other side at the extremes. The last embedded nature for Silver on the daily chart occurred a year ago, late March 2023, that saw price on silver rise from 19.90 to 26.50. For three weeks, slow stochastic was embedded. We are at that point again with this rally. We are also at resistance from the wedge pattern. While I do think we can trade down in the early part of this week, I'm looking for support and a rally to kick us back into the overbought range and embed or "lock-in" price action. Gold has already embedded. I'm looking for silver to do the same and get us through the topside for a breakout.

Silver Future Silver Future Weekly chart forming Ascending Triangle Pattern waiting for breakout.. it will make new high so buy silverbees to invest buy every dip..

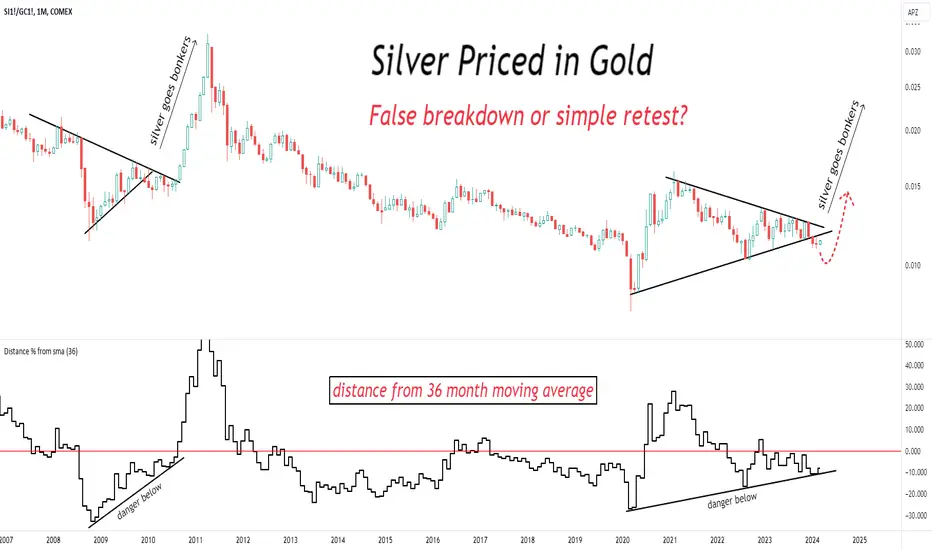
#Silver priced in #Gold.#Silver priced in #Gold.
False breakdown or simple retest?
We will find out soon enough...
Sell May Silver 22.58. Stop is 23.26 and target is 22.26Looking for a small break out of recent trading ranges and start of a move down.

SilvermSilverm not going to stop any resistance. 74000 is psychological target . So follow the level and stay tuned in up direction.

silver Elliot wave setup date 04/03/2024silver Elliot wave setup shared , wave count with possibilities of wave 5 materialization.

Options Blueprint Series: Iron Condors for Balanced MarketsIntroduction:
In the nuanced world of options trading, the Iron Condor strategy stands out as a sophisticated yet accessible approach, especially suited for markets that exhibit a balanced demeanor. This strategy, belonging to the "Options Blueprint Series," is designed for traders who seek to harness the potential of stable markets. Iron Condors offer a way to generate profit from an underlying asset's lack of significant price movement, making it an ideal choice for periods characterized by low volatility.
Understanding Iron Condors:
An Iron Condor is a non-directional options strategy that aims to profit from a market that moves sideways or remains within a specific range. This strategy involves four different options contracts, specifically two calls and two puts, all with the same expiration date but different strike prices. It combines a bull put spread and a bear call spread to create a profitable zone.
To construct an Iron Condor, a trader sells one out-of-the-money put and buys another put with a lower strike price (forming the bull put spread), while also selling one out-of-the-money call and buying another call with a higher strike price (forming the bear call spread). The essence of this strategy is to collect premium income from the options sold, with the trade being most profitable if the underlying asset's price remains between the middle strike prices of the calls and puts sold.
The Iron Condor is lauded for its ability to generate returns in a stagnant or mildly volatile market, making it a preferred strategy among traders who anticipate little to no significant price movement in the underlying asset. However, it requires precise execution and an understanding of the underlying market conditions to mitigate risk and optimize potential returns.
Market Analysis:
The current financial landscape often presents scenarios where markets exhibit balanced behavior, characterized by low volatility and minor price fluctuations. In such environments, traditional directional trading strategies might not always offer the desired outcomes due to the lack of significant market movements. This is where the Iron Condor strategy shines, serving as an ideal tool for traders aiming to capitalize on market stability.
Balanced markets are typically observed during periods of economic uncertainty or when major market-moving events are anticipated but have yet to occur. Investors' wait-and-see attitude during these times results in a trading range where prices oscillate within a relatively tight band. Utilizing Iron Condors in these scenarios allows traders to define a price range within which they believe the market will remain over the life of the options contracts. Successfully identifying these ranges can lead to profitable trades, as the sold options will expire worthless, allowing the trader to retain the premiums received.
Implementing Iron Condors under such conditions requires a keen understanding of market indicators and trends. Traders must analyze historical volatility, forthcoming economic events, and overall market sentiment to gauge whether the market conditions are conducive to this strategy. This analysis is crucial in setting the strike prices for the options contracts, determining the width of the Condor's wings, and ultimately, the trade's risk-reward profile.
Introduction to Silver Futures:
Silver Futures represent a standard contract for the future delivery of silver, a precious metal with both investment appeal and industrial applications. Trading on the COMEX exchange, these futures provide a crucial tool for hedging against silver price volatility and speculating on future price movements.
Key Features of Silver Futures:
Contract Specifications: A standard Silver Futures contract on the COMEX division of the New York Mercantile Exchange (NYMEX) typically involves 5,000 troy ounces of silver. The price quotation is in U.S. dollars and cents per ounce.
Point Values: Each tick (0.005) movement in the silver price represents a $25 change in the value of the Silver Futures contract. This point value is critical for calculating potential profits and losses in silver trading.
Trading Hours: Silver Futures are traded almost around the clock (23 hours per day) in electronic trading sessions, providing opportunities to react to global economic events as they unfold.
Margin Requirements: Trading Silver Futures requires a margin deposit, a form of collateral to cover the credit risk. The initial margin is set by the exchange and varies with market volatility. The current recommendation set by COMEX is $8,000 per contract.
Options on Silver Futures:
Options on Silver Futures offer traders the right, but not the obligation, to buy (call options) or sell (put options) the futures contract at a specified price before the option expires. These instruments allow for strategies like Iron Condors, providing additional flexibility in managing silver price exposure.
Applying Iron Condors to Silver Futures Options:
Implementing Iron Condors within the realm of Silver Futures Options requires a strategic selection of strike prices that reflect a balanced market's expected trading range. By capitalizing on Silver's historical volatility patterns and current market analysis, traders can construct Iron Condors to optimize their chances of success.
Trade Setup:
Underlying Asset: Silver Futures (Symbol: SI1!)
Market Conditions: Anticipation of a stable to mildly volatile market environment.
Strategy Components:
Sell Put Option: Strike Price $22.50
Buy Put Option: Strike Price $21.95
Sell Call Option: Strike Price $23.85
Buy Call Option: Strike Price $24.30
Net Premium Received: 0.2680 points = $1,340
Maximum Profit: Net Premium Received $1,340 per contract
Maximum Loss: Difference between strike prices minus net premium received = 0.55 / 0.005 x 25 – 1,340 = $1,410 per contract
Trade Rationalization:
This trade setup is designed to profit from a range-bound market, where the price of silver is expected to remain between key support and resistance price levels until the options' expiration. The selected strike prices reflect a balanced view of the silver market, aiming to maximize premium income while limiting risk exposure. The trade's success hinges on silver prices staying within the defined range, allowing all options to expire worthless and the trader to retain the collected premiums.
Trade Management:
Managing risks associated with Iron Condors involves closely monitoring silver prices and being prepared to adjust the strategy in response to significant market movements. This may include rolling out positions to different strike prices or expiration dates, or closing out the position to mitigate losses. Understanding the nuances of Silver Futures and their options is crucial for effective risk management in this strategy.
Risk Management:
Effective risk management is paramount when employing Iron Condors, particularly in the volatile commodities market. The Iron Condor strategy, by design, limits the maximum potential loss to the difference between the strike prices of the inner options minus the net premium received. However, market conditions can change swiftly, leading to potential challenges that necessitate proactive risk management techniques.
Monitoring Market Conditions: Continuous observation of market dynamics is essential. Significant economic announcements, geopolitical events, or changes in supply and demand can impact silver prices drastically. Traders should stay informed and ready to act if the market moves against their position.
Adjusting Positions: In the event of unfavorable market movements, traders may need to adjust their positions. This could involve closing out the position early to cut losses or 'rolling' the strategy to different strike prices or expiration dates to better align with the new market outlook.
Use of Stop-Loss Orders: While not always applicable in options trading, setting conditional orders to exit positions can help limit losses. For Iron Condors, this might mean closing the trade if the potential maximum loss is approached.
Diversification: Employing Iron Condors as part of a broader, diversified trading strategy can help mitigate risks. No single trade should expose the trader to disproportionate risk.
Conclusion:
The Iron Condor strategy offers a prudent approach for traders looking to capitalize on balanced markets, such as those often encountered with Silver Futures and Options. By selling options with strike prices outside the expected range of movement and protecting the position with further out-of-the-money options bought, traders can receive premium income while having a clear understanding of their maximum risk exposure.
This strategy thrives in environments of low to moderate volatility, where the underlying asset—silver, in this case—is expected to fluctuate within a predictable range. The inclusion of Silver Futures and Options in this strategic framework not only illustrates the versatility of Iron Condors but also underscores the importance of comprehensive market analysis and robust risk management practices.
By meticulously crafting their positions, monitoring market conditions, and being prepared to make adjustments as necessary, traders can effectively navigate the complexities of the commodities market, harnessing the potential of Iron Condors to enhance their trading portfolio.
When charting futures, the data provided could be delayed. Traders working with the ticker symbols discussed in this idea may prefer to use CME Group real-time data plan on TradingView: www.tradingview.com This consideration is particularly important for shorter-term traders, whereas it may be less critical for those focused on longer-term trading strategies.
General Disclaimer:
The trade ideas presented herein are solely for illustrative purposes forming a part of a case study intended to demonstrate key principles in risk management within the context of the specific market scenarios discussed. These ideas are not to be interpreted as investment recommendations or financial advice. They do not endorse or promote any specific trading strategies, financial products, or services. The information provided is based on data believed to be reliable; however, its accuracy or completeness cannot be guaranteed. Trading in financial markets involves risks, including the potential loss of principal. Each individual should conduct their own research and consult with professional financial advisors before making any investment decisions. The author or publisher of this content bears no responsibility for any actions taken based on the information provided or for any resultant financial or other losses.
