Traders gaining momentum: Fall edition!Hey everyone! 👋
Grab your beverage of choice: it's time to sit back, relax, and take a look at some of the hottest up and coming authors on TradingView. All of these folks deserve a follow, so be sure to show them some love! ❤️❤️
If you think we’re missing someone, be sure to make it known below in the comments. Also, we’ll be doing these roundups from time to time so be sure follow us so you don’t miss any of them!
Let’s jump in.
We’ve sorted each Author by the asset class they focus on. Click on their profile and see if you like the ideas they're putting out!
Multi-Asset:
Trade_Journal
TrendLINEBoys
NoFomoCharts
ZenMode
Valerus_Forex
Vixtine
SquishTrade
LupaCapital
Stocks & Indices:
dpuleo19
nuggetrouble
rossgivens
MarthaStokesCMT-TechniTrader
Crypto:
decklyndubs
natef1
Currencies:
jamison_fx
DemoDiaryFX_Trading
CarterKyleCapital
Lightwork_
WallStreetIntelligence
And there you have it! Our roundup. As we mentioned before, don’t forget to follow TradingView for regular educational content :)
Think we missed any up-and-coming accounts? Point them out in the comments! Obviously, don’t shill yourself. 😉
Cheers!
-
Please remember Editors' Picks and all the authors we mention are our attempt to show undiscovered traders, unique market insights, and interesting educational material.
Anyone can be featured in Editors' Picks or in posts like this. All it takes is publishing an idea from your account. We try to be as fair as possible, following many of you, and reading all the different ideas published daily.
That's it! High quality content, consistency, clarity, and the will to help others is what we look for.
You can read all of our guidelines below:
www.tradingview.com
www.tradingview.com
www.tradingview.com
Silver Futures
SILVER1! trade ideas

Re-opened silver longnow the 1.61 target is reached,
looking for a correction till we reach the
2.0 target
but taking every 5 min opening breakout for re-entries long...
also the breaking of tripple tops on 5 min chart suggest a trend continuation...

Silver Market near to bottom Silver got off to a good start and built a clean 5-part move through September 12, where it closed the wave at $20,020 per ounce. Expected after wave is a correction between the 0.618 Fibonnaci retracement and the 0.887 Fibonacci retracement. This area, starting from 18.4$ has silver now expired and with the entry of the territory of the (i) now the alternative wave (iv) excluded.
Silver is expected to change trend direction in the pink trend reversal area and complete the , then continue to rise higher in a wave .

Silver Explodes - A Lesson To Track Shifts In Order FlowHey traders,
In today’s analysis, it’s hard to ignore Silver following the 🚀explosive🚀 8%+ move up.
Let’s unpack the action as of late via the OFA script :
To do so, I am not going to apply any subjective type of analysis such as drawing trendlines, counting waves based on what way the wind blows, or any other form of guessing game…
Instead, we let the formation of fractal structures (objective measure of moves) create the pathway from which we can all make decisions. Fortunately, there is no need to engage in laborious manual work?
Why? The OFA script has all of us covered. So, with that in mind, what can we observe in the silver market?
What recurring pattern do you notice? Clue - Pay attention to the visual Ms and Ws type pattern forming…
These patterns entail, as stated in the chart, “dynamic fractal-based order flow cycles where a decreasing involvement in one direction (depicted by cycle/wave/line counts leads to a predictable move in the opposite direction seeking out the next equilibrium area, in most instance, with potential profits as a by-product…”
If you are into disseminating order flow, nothing I’ve seen beats the objectivity in analysis one can carry out via the formation of structures derived off fractal structures. Note, the chart ignores the dominant trend and simply focuses on the M and W patterns. Can you imagine if you start to align trading in the direction of just simply the dominant trend in the higher timeframes + proper risk management? Let you fantasise with that!
Remember the two key main features of the OFA script:
Magnitude: A major clue that will help determine the health of a trend is the type of progress by the dominant side in control of the trend. We need to ask the following question: Are the new legs in the active buy-sell side campaign as identified by the script increasing or decreasing in magnitude?
Velocity: When it comes to the distance the price moves, the magnitude is only ½ the equation. The other ½ has to do with the velocity of the move or the speed. Was the new leg created after a fast and impulsive move? Or did price make a new low or high with the movement being sluggish, compressive and taking too long to form? A good rule of thumb is to count the number of candles it took to achieve a new leg.
DISCLAIMER: This post contains commentary published solely for educational and informational purposes. This post's content (and any content available through links in this post) and its views do not constitute financial advice or an investment or trading recommendation, and they do not account for readers' personal financial circumstances, or their investing or trading objectives, time frame, and risk tolerance. Readers should perform their own due diligence, and consult a qualified financial adviser or other investment / financial professional before entering any trade, investment or other transaction.

Long Term VWAP trend has turned bullish for Silver after 11 yrsAtfter 11 years of bearish VWAP trends in silver... it has turned bullish and is testing. Silver is interesting as we sit in this "inflationary" environment. I say "inflationary" with quotes as we have a CRB index rising WITH the DXY. This hasn't occurred since the early 1970's and points more towards a supply issue vs. a monetary problem. Hence we see things like food and oil scream higher while metals have been lagging. This bullish turn on the VWAP in silver could be pointing a change in the metals' action in the medium term though. A confirmation would require a break and hold above the highest VWAP, which failed and failed hard in April.
I was much more confident in a break out where we failed and was wrong... yet this setup still has strength behind it. If price gets back above the upper VWAP I will be keeping a close eye on metals into the fall.

Silver 10.32.22 This is an incredible market for silver. I spent a lot of time framing the market so that you could understand that it's a ranging market and it is an expanding market, but it is not a trending market yet. I show you how you could use some of the tools to facilitate your trading and project Target's more effectively. This video I showed you three different boxes. All of them were helpful at the time, but the range box that we were working with at the end of the video one we want for now. See if you can make sense of this. it's very important to define your market and make distinctions between contracted and expanded markets, and trending vs. ranging markets.

Taking some profits 20.5$ on silvernice breakout on silver
seasonality also shows positive october trends
taking some profits at the 20.5$ level and then after a pullback another long trade...

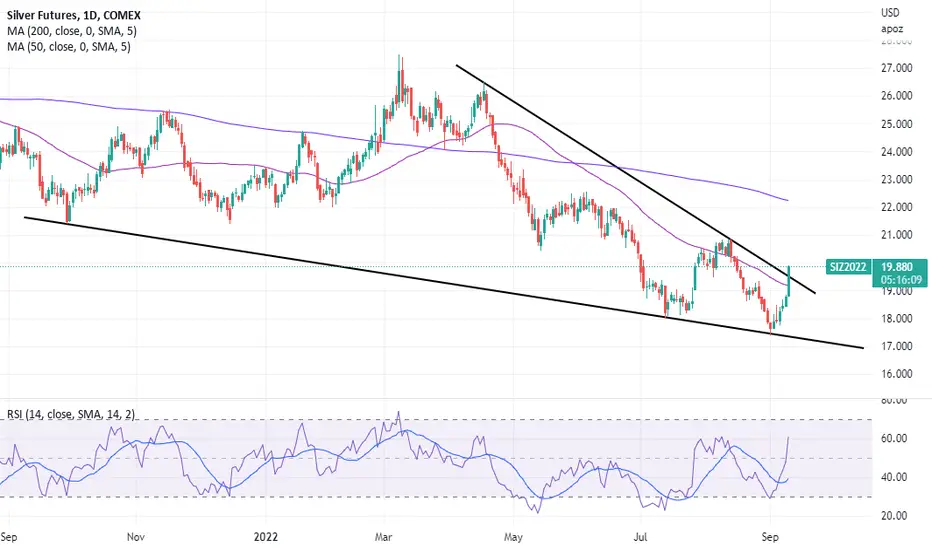
Silver Back Testing TrendlineSilver is having a nice rally into the end of the week as the dollar has come off the highs we saw out above 114 from earlier in the week, which was a headwind for the precious metals. Silver is now looking to back test the trendline from the July lows, which is also directly in line with the 50-day moving average. As we roll into next week, if we can see continued weakness from the dollar off the highs, we may see Silver break through the 50-day moving average and look to test strong technical resistance going back from the May highs.
Silver To Lose Its Shine...AgainIn this update we review the recent price action in the Silver futures contract and identify the next high probability trading opportunity and price objectives tot arget

SILVERHELLO GUYS THIS MY IDEA 💡ABOUT SILVER SL1! is nice to see strong volume area....
Where is lot of contract accumulated..
I thing that the buyers from this area will be defend this LONG position..
and when the price come back to this area, strong buyers will be push up the market again..
UP TREND + Resistance from the past + Strong volume area is my mainly reason for this long trade..
IF you like my work please like share and follow thanks
TURTLE TRADER 🐢

Silver Order Flow - Screams Sell-Side ActionRoll up your sleeves and get to work on your order flow reading skills!
This market is providing opportunities based on the right interpretation of the order flow script like few times I’ve seen…
Don’t trust me? Watch the video and judge by yourself.
In my last video it was gold, so this time is the turn of the younger brother silver.
This one has got a double whammy of events against buyers…
Not only the 8h has triggered a short, but that comes on the back of a short entry off the hourly…
All happening in the context of a clear and strong bearish trend in the daily as the USD torpedoes ahead.
Remember the two key main features of the OFA indicator:
Magnitude: A major clue that will help determine the health of a trend is the type of progress by the dominant side in control of the trend. We need to ask the following question: Are the new legs in the active buy-sell side campaign as identified by the script increasing or decreasing in magnitude?
Velocity: When it comes to the distance the price moves, the magnitude is only ½ the equation. The other ½ has to do with the velocity of the move or the speed. Was the new leg created after a fast and impulsive move? Or did price make a new low or high with the movement being sluggish, compressive and taking too long to form? A good rule of thumb is to count the number of candles it took to achieve a new leg.

Small Timeframe SilverWe are anticipate of SI to find sellers around the line and retrace fib back to 16 ish, where long will be high in equity

Silver near major support ZoneSilver ending below 50 days EMA of 56557 is not a very good news for Silver enthusiasts. Final support for Silver might be near 55375. Below 55375 Silver may fall to 54202 or as low as 51899. Way up silver is looking little difficult as there are many resistances on the way up starting from 56557. Other resistance on the way up can be 58177 and 59580. If silver does not take support at 55375 and bounce back it slide in silver can be sleek and super fast.

Silver short setupPossible Silver short setup forming on HTF.
Use LTF entry to get better R:R & Validations.

Coffee9. 21. 22 this is a five minute follow up on coffee which way about $6,000 higher since the reversal at the bottom on Monday. I don't think the probability factor is has clear here, as there is an argument for the market correcting lower and there's an argument that the market might go higher. For me this is a harder trade decision other than my predisposition is to just take the money if I'm not sure. I suppose I am thinking more like a scalper.

Silver Market (30m)The silver market is in a clean 5-part uptrend right now. The correction was completed cleanly between the 0.618 and 0.786 Fibonacci retracement and since then it has been impulsively moving upwards. The (iii) has captured the 2.618 Fib extension and then completed cleanly into the (iv) (around the 0.5 Fib). Now silver is in the ii of the (v) of the . If silver does not penetrate the area of the below 18.745, it can be assumed that the analysis is correct. If the price turns within 19.1 and 18.8 in the ii, we are in wave iii of the (v) of the .
I am eager to hear your ideas!

DeGRAM | SILVER longSilver's price went down from its recent resistance level and created a complex pullback.
The market is gaining momentum
Price action is likely to break the resistance level and go up.
-------------------
Share your opinion in the comments and support the idea with like. Thanks for your support!

Friday similar to mondayhappens quite often that if monday is bullish, the friday will also be bullish or bearish if monday was bearish
nevertheless long trades have been triggered on the 2 hour chart for these symbols:
ZL SI ZS
will they last long? I dont know, but now prices are cheap so I will take almost all long signals...
but if prices cant stay above fridays close i am willing to exit ...

SilverBullish RSI divergence at weekly demand following through this week. No position but something to keep an eye on these next few weeks.


Silver: Keep the Pot Boiling 🫕Quite peppily, silver has vaulted upwards, only to stop short in front of its next destination. Now, it should keep the pot boiling and take up speed anew to make it into the upper green zone between $20.12 and $20.70, where it should finish wave 3 in green. After a short counter movement into the lower green zone between $19.56 and $18.93, silver should continue to climb northwards. There is a 40% chance, though, that silver might need a break and could drop below the support at $17.40. In that case, it should take a detour through the magenta colored zone between $17.23 and $14.14 first before rising effectively.

COT Positioning Indicates Bullish Opportunity in SilverLarge speculators in silver hold a large short position. Net short positions in silver are rare and typically occur near a major low in the silver price. -Jamie

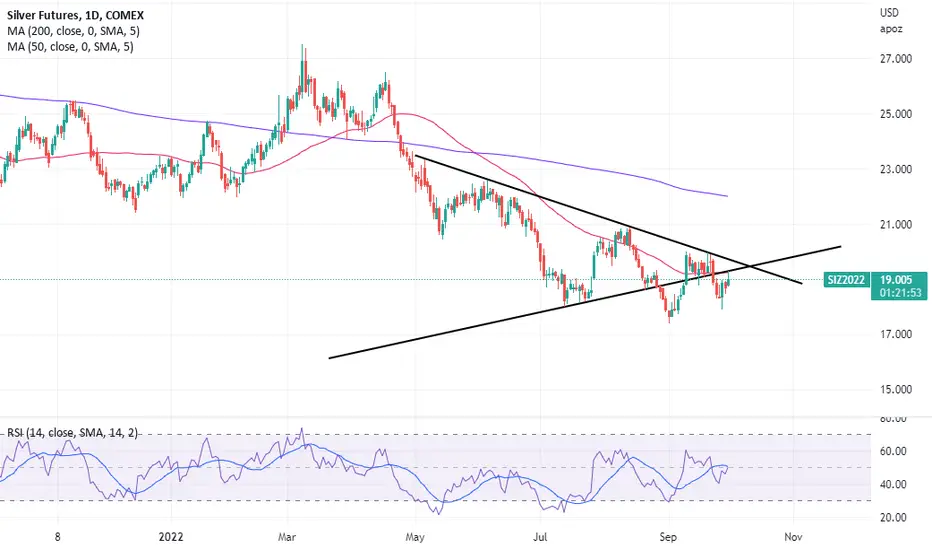
Silver Surging HigherSilver has been in a downward range since the March highs, and is now showing some life to the upside, breaking through the 50-day moving average. We hit a fresh low near 17.50 and were in oversold territory, and since then the market has melted to the upside through strong resistance. Silver still has a ways to go to recoup the losses on the year, still down around $3.00 since the start of 2022. All eyes are on CPI tomorrow and how the dollar will hold near strong support levels, which will be a major catalyst for the precious metals.