MELANIA: Divergence, Signal, BaseThis is MELANIA on the 1-day chart.
First, I want to emphasize the bullish divergence on the RSI, which started on April 21, while price continued to drop, RSI held or even moved higher.
Second, although we’re still below the 50MA and the chart doesn’t yet have a 200MA, both systems are long:
• PSAR is bullish
• MLR > SMA > BB Center
Third, it appears a base has been forming since June 27.
All these factors combined led me to open a long position, but of course, this is just my view, not financial advice.
Always take profits and manage risk.
Interaction is welcome.
MELANIAUSDT trade ideas

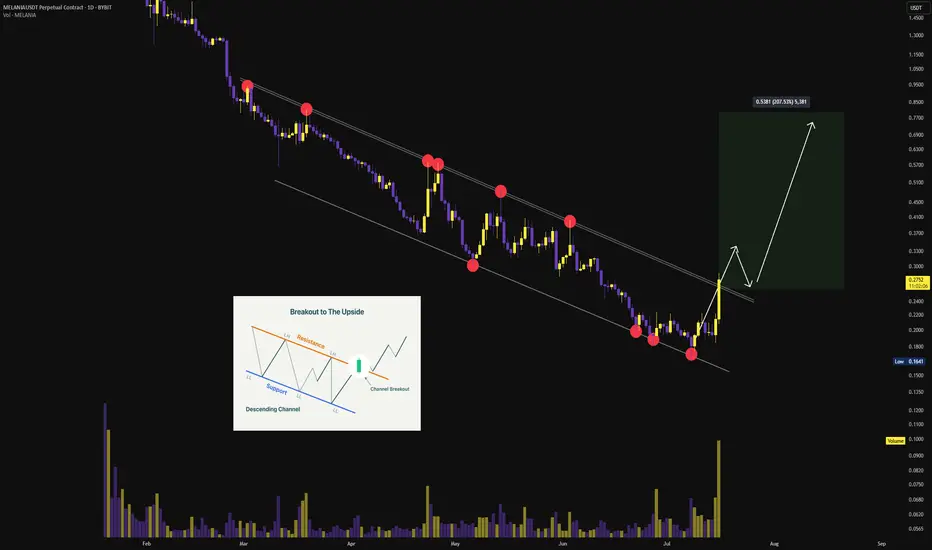
$MELANIA | Descending Channel Breakout Confirmed After months of compression within a well-respected falling channel, #MELANIA has printed a high-volume breakout above the channel resistance — confirming a reversal structure with strong momentum expansion.
🔍 Technical Confirmation:
• Breakout from long-term downtrend resistance
• Multiple clean touches on channel boundaries (valid structure)
• Bullish engulfing candle with volumetric confirmation
• Price action suggests potential retest before continuation
🎯 Upside Targets based on measured move and fib projections:
→ $0.40 (structural pivot zone)
→ $0.50 (supply confluence)
→ $0.80 (channel height projection)
Watch for bullish retest of breakout zone to confirm continuation
Melania Trump Token Near Its Breaking Point – Bounce or BreakdowA Crossroad for MELANIAUSDT: Is the Reversal Real or a Mirage?
In a dramatic twist of fate, Melania Trump's meme token (MELANIAUSDT) has rebounded over 11% from its all-time low of $0.1811, set just two days ago. The current price sits at $0.2016, still nearly 99% below its euphoric peak of $14.50 from January. With Relative Strength Indexes (RSI14 at 51.1 and RSI60 at 48.7) signaling a neutral zone and the MFI showing modest inflows (56.0), the market is hesitating—undecided between exhaustion and opportunity.
Yet beneath the surface, tension is building. Despite massive recent sell-offs, a flurry of powerful VSA Buy patterns has appeared, hinting at potential accumulation. Price is coiling tightly around the 50-day and 100-day moving averages (0.2012 and 0.2014 respectively), setting the stage for a volatility burst. Traders are now watching the 0.2173 resistance zone like hawks—can MELANIA break through and retest higher liquidity levels?
Macroeconomic uncertainty and post-election crypto buzz add fuel to the fire. Could Trump's public stance or policy whispers inject speculative lifeblood into this once-hyped token?
Whether you're a long-term investor scouting for a reversal or a scalper eyeing short-term momentum, MELANIA is standing at a technical inflection point. The question now: Will the next move be a relief rally... or the final capitulation?
Roadmap: MELANIAUSDT Price Manipulation Unveiled
Let’s walk through the recent story MELANIAUSDT has been telling — candle by candle, pattern by pattern. Only the real plays, where the market truly respected the setup, made the cut here.
June 27, 07:00 UTC – VSA Buy Pattern Extra 1st appears:
The setup screamed "bounce incoming!" after a deep dive. With price at $0.1893 and a low around $0.1888 — almost kissing the absolute bottom — we got a clean reaction. The price lifted in the following sessions, proving this wasn’t just noise. The market respected the buy zone and traders who listened to this whisper from the VSA playbook were rewarded.
June 28, 10:00 UTC – Buy Volumes Max kicks in:
The bulls roared louder. Volume surged, price jumped from $0.2034 to $0.2168, challenging the $0.2243 high — that’s a textbook confirmation of the previous bullish intent. Anyone still doubting the reversal? This was the second tap on the shoulder.
June 28, 15:00 UTC – Sell Volumes arrive… but do they dominate?
Here’s the twist. A heavy sell volume pattern forms with price closing at $0.2048, but critically, it doesn’t knock out the previous bullish levels. Instead of a meltdown, we see consolidation — a classic bull trap fake-out or just a breather? Either way, this didn’t cancel the bullish setup from earlier. It paused it.
What’s key here? Every legitimate VSA buy pattern had one thing in common — follow-through. The market moved in the intended direction with clean volume footprints. That’s the game. These weren’t just chart doodles — they were trading signals with teeth.
Next time you see VSA Extra or Buy Volumes fire up again near key support? You might want to listen. This roadmap proves it.
Technical & Price Action Analysis
Here’s the level map every serious trader should have on their radar for MELANIAUSDT. These aren’t just numbers — they’re where the action happens.
Support Zones to Watch for Dips and Reloads:
0.1827 – Local support, tested recently. If it fails, expect it to flip into resistance real quick.
0.5394 – Major support. If the market ever comes back here, that’s deep value territory.
0.5852 – Stronghold level. Expect buyers to show up in size.
Resistance Zones – Take-Profit Traps or Breakout Launchpads:
0.2173 – Immediate upside test. Bulls need to break and lock above to confirm momentum.
0.2266 – Watch this for fakeouts. Price may tap it and snap back.
0.2464 – Mid-range resistance. A flip here changes the whole structure.
0.2744 – Strong sell wall ahead. Needs volume to smash through.
0.2875 – Key breakout marker. Clearing this opens room for serious upside.
Heads-up: Any level that fails to hold as support will act like a ceiling on the way back up. That’s trading 101 — broken floors become rooftops. So stay sharp and don’t get trapped on the wrong side of the move.
Strategy: Trading the Rays – Navigating Dynamic Price Zones
Let’s break down how to actually trade MELANIAUSDT using the "Rays from the Beginning of Movement" method — a strategic framework based on Fibonacci geometry that doesn’t just predict, but reacts to what the market is telling us in real-time.
The game plan here is simple but powerful: price always reacts to the rays. These reactions give you two choices — get in on a reversal or ride the continuation to the next ray. Levels aren't static; they evolve with the market. We don’t chase fixed targets. We track flow.
These rays intersect with key Moving Averages (MA50 at 0.2012, MA100 at 0.2014, MA200 at 0.207, MA233 at 0.2115) and VSA zones already drawn on your chart. What you see isn’t random — it’s structure.
Optimistic Scenario – Momentum Ignites from the Ray Zone:
Long from 0.2015 (price + MA50 cluster)
- First target: 0.2173 – Key resistance and breakout trigger
- Second target: 0.2266 – Medium-term seller interest
- Third target: 0.2464 – High conviction profit zone
Aggressive Entry from 0.207 (MA200 bounce)
- Expect fast action toward 0.2173 and above. Volume needs to confirm.
Ray Break + Close Above 0.2173
- Bullish confirmation to aim for 0.2464 and possibly stretch into 0.2744 – but only if MA233 flips support
Pessimistic Scenario – Failure to Hold Dynamic Support:
Short below 0.2012 (MA50 fails + ray rejection)
- First target: 0.1827 – Local floor and recent bounce point
- Second target: 0.1811 – Absolute low. If this breaks, it’s open air
If price taps 0.2173 and sharply reverses
- Enter short post-rejection
- Target: 0.2015 support zone for scalp, lower if momentum confirms
Core Rules:
You don't enter until the ray says go. You don’t guess — you react. After the price touches a ray and gives a reaction — a VSA pattern, volume spike, or candle confirmation — that’s your green light. Trades move ray to ray. That’s your roadmap. Let others chase noise. You follow structure.
Let’s Keep the Conversation Going
If you’ve got questions, ideas, or just want to talk shop — drop them right in the comments. I read everything and I’m always happy to chat with fellow traders.
If this analysis helped you see the market a bit clearer, hit that Boost and save it to your ideas. Come back in a few days and watch how price respects the levels and rays — that’s how we learn and grow in this game.
By the way, all the rays and levels you see here are drawn automatically by my private indicator-strategy. It’s not public, but if you’re interested in using it, just send me a direct message — we’ll figure something out.
Need a custom analysis for your favorite coin or asset? I can do that too. Some ideas I share openly, others we can keep private if you prefer — just let me know your style.
These rays work on any asset. If there’s a chart you want me to break down, hit Boost and write it in the comments — I’ll do my best to include it in the next posts.
And don’t forget to follow me here on TradingView. This is where I share all my setups and insights first. Let’s trade smart together.

melaniaWe have a series of numbers that can be considered as medium-term targets. But in the short term, the red box is in the way as resistance.

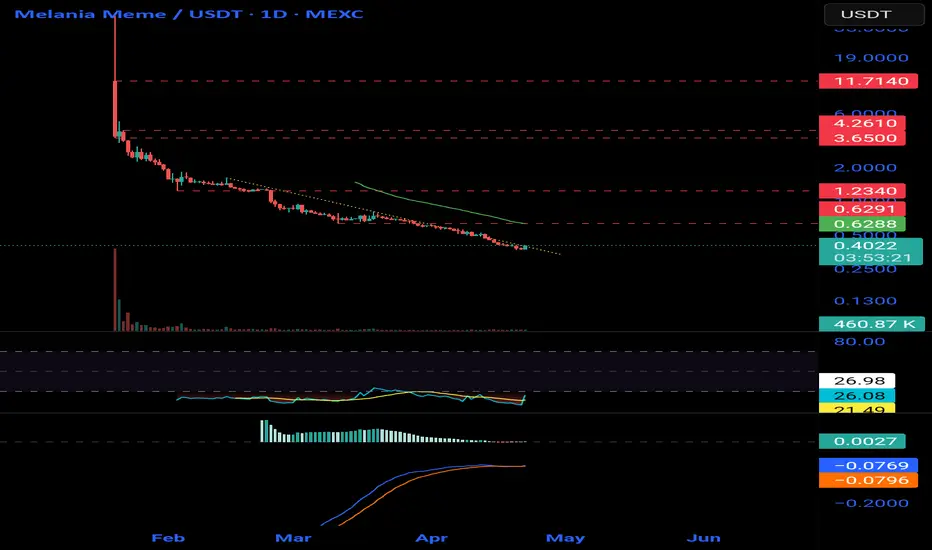
Analyse melania meme coinAs we see the price was very hard down since the list of the coin now we can see the reflex of price from o.3 make a bottom

MELANiA: $0.41 | The Deal is On towards FRESH HiGHStalks about the most discrete meme
issued during TRUMPS inauguration and
well launched with volume and syndicated listings
dealer network established'
for friends of friends who invested
to make a killing back to all time highs
for PUBLIC at the HIGHS
hang in there
or meet you back at key settlement levels
Strategy: it is what it is

MELANIA go BOOM?Its purely based on DOM and some internal things i happen to feel! rest you to watch, expecting a small spring for the catchup!

MELANIA TRUMP EASY 100% Melania can pump harder than TRUMP has a smaller cap.
Only if this is truly the time for a reversal
Fingers Crossed !
Now: it got rejected by SuperTrend generated resistance at 5.1usdt (this 30m timeframe)
Can also Re -Test 3.6usd to complete inversed triangle pattern - very powerful :P

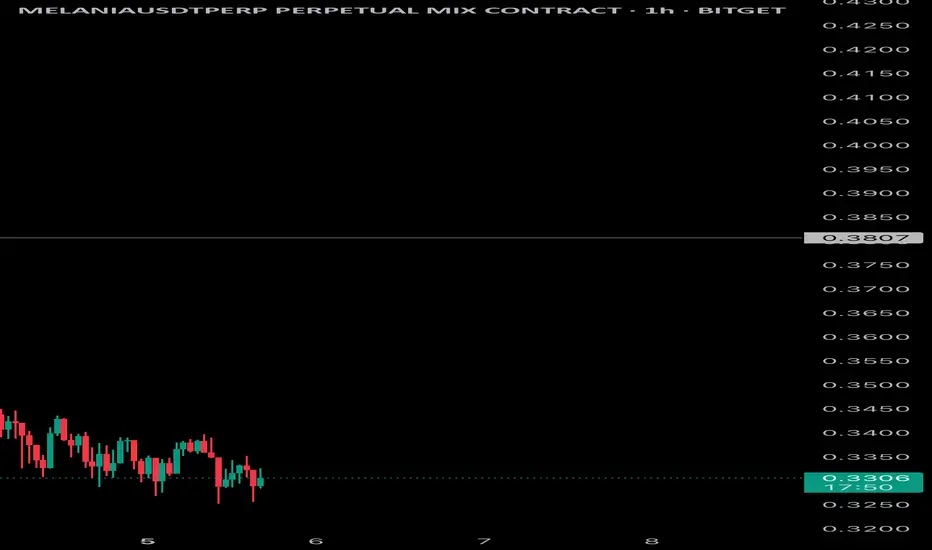
MELANIAUSD: Extended Downtrend + Accumulation at Key Support After a steep breakdown from the $0.3807 support, MELANIAUSDT has entered a prolonged period of low volatility and consolidation in the $0.32–$0.34 range. This type of price action often signals a potential accumulation phase following a capitulation move.
The price has failed to reclaim the previous key level at $0.3807, which now serves as strong resistance. However, sellers are showing signs of exhaustion, with each new low being marginal and quickly bought up.
I’m watching this zone closely for a volatility expansion — either a relief bounce toward $0.36–$0.38 or a breakdown to test the $0.30 psychological level.
Melani follows trumpSame pattern as trump. All you need is a good setup to find out how whales work. 7-star is the only indicator tailored to catch pumps like these.
for indicator access you can drop a message
DYOR


MELANIA Roadmap (4H)It seems that MELANIA is caught in a large bearish Diametric!
A meme coin left to the market!
It appears to be in wave D of this Diametric.
From the supply zone, we expect another rejection toward lower levels.
The closure of a daily candle above the invalidation level will invalidate this analysis.
For risk management, please don't forget stop loss and capital management
Comment if you have any questions
Thank You

MELANIA Hi,
It failed its first initial breakout, retested the trend and we are currently witnessing a move higher.
I have moved my SL to entry to make it a risk free trade while the FOMC is going ahead later today.

MELANIA MEME COIN TO THE MOON – 800% BY SUMMER 2025! Ladies and gentlemen, buckle up! Melania Coin is about to do what even Melania Trump couldn’t—stick around for the long haul. Experts (aka my cousin who trades from his mom’s basement) predict an 800% explosion by Summer 2025.
Why? Because logic doesn’t apply in meme land. Dogs had their run, frogs got their shine—it’s time for First Lady finance.
Technical analysis? It’s bullish.
Fundamentals? Who cares?
Vibes? IMMACULATE.
By 2025, you’ll either be sipping mojitos on a yacht or explaining to your friends why "just one more dip" was a bad idea. Choose wisely. 😂

MELANIA - Pennant Hi,
I am trading the potential pennant if we see a breakout to the upside.
Target is roughly $0.80. Entry would be $0.73.
GL if you join,

MELANIA Looks Bearish (1H)The situation with the meme coin MELANIA doesn't look good.
There is limited data available for this meme coin, but on the chart, 3 ABC waves of a pattern can be identified.
If wave C drops to the 0.618 or 0.786 Fibonacci levels of wave A, it may reach the specified targets on the chart.
The chart currently lacks a trigger for entering a position.
For a sell/short position, it's better to wait for the price to reach the red zone. For a buy/long position, we need to see reversal patterns along with confirmations.
For risk management, please don't forget stop loss and capital management
Comment if you have any questions
Thank You

MELANIA - TIME FOR PAYBACK!WHAT a RUG! Its not less than a rug! But play like the whales! Added 4hour chart where Ive marked a bottom green box where you can actually do buy it, till two stops, red and oranges!!

MELANIA coin from Top to BottomMELENIA coin from Top to Bottom
should we call this a big scam?
I hope you didn't get caught (loss to the coin) with this coin.

Official Melania Meme / MELANIAHello guys, this is my smart short idea.
Total supply: 999.99M MELANIA
Max. supply: 1B MELANIA
Circulating supply: 192.21M MELANIA
About Official Melania Meme
Melania memes are digital collectibles intended to function as an expression of support for and engagement with the values embodied by the symbol MELANIA. and the associated artwork, and are not intended to be, or to be the subject of, an investment opportunity, investment contract, or security of any type. melaniameme.com/ is not political and has nothing to do with any political campaign or any political office or governmental agency. See Terms & Conditions Here
The development so far doesn't look very positive.
I think in short, this go to bottom 1 usdt and maybe less!!
Possible move up from here around 4 usdt, 7 usdt.
New ath 40 usdt, long? that will never happen.
Good luck!
This is only my idea guys.
This is not financial advice !
Please do your analysis and consider investing !! Thanks

Bullish on $MELANIA1. We have MSS illustrated by the lightbulb icon
2. We have market respecting and finding support at the reclaimed orderblock
3. We have buyside draw and OTE OB- to reach
This is a mean reversion setup

MELANIA - Be MelancholyEQH is there means its going to hit up liqui shorts, but when they do this, you know what to do! Just dont blank longs!!!!!!!!! PLEASE!

