melaniaWe have a series of numbers that can be considered as medium-term targets. But in the short term, the red box is in the way as resistance.
MELANIAUSDT trade ideas

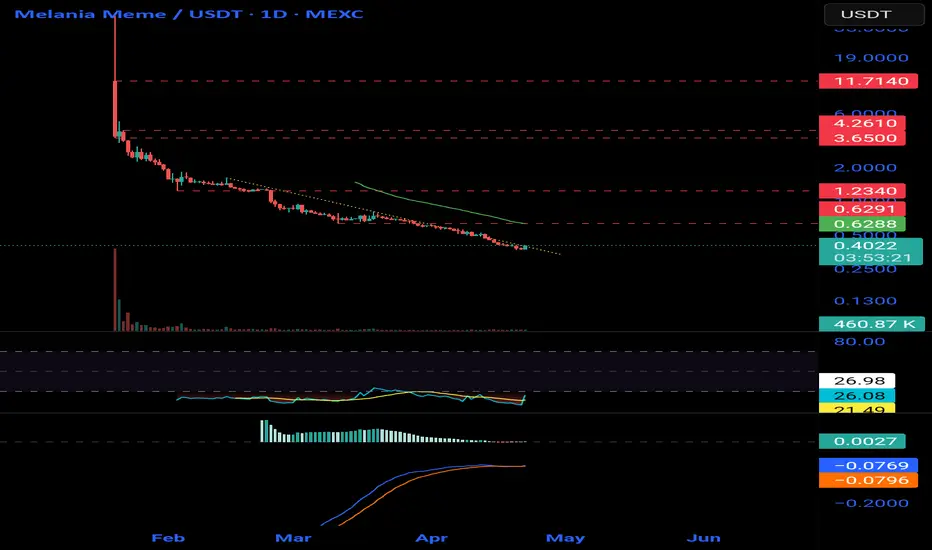
Analyse melania meme coinAs we see the price was very hard down since the list of the coin now we can see the reflex of price from o.3 make a bottom

MELANiA: $0.41 | The Deal is On towards FRESH HiGHStalks about the most discrete meme
issued during TRUMPS inauguration and
well launched with volume and syndicated listings
dealer network established'
for friends of friends who invested
to make a killing back to all time highs
for PUBLIC at the HIGHS
hang in there
or meet you back at key settlement levels
Strategy: it is what it is

MELANIA go BOOM?Its purely based on DOM and some internal things i happen to feel! rest you to watch, expecting a small spring for the catchup!

MELANIA TRUMP EASY 100% Melania can pump harder than TRUMP has a smaller cap.
Only if this is truly the time for a reversal
Fingers Crossed !
Now: it got rejected by SuperTrend generated resistance at 5.1usdt (this 30m timeframe)
Can also Re -Test 3.6usd to complete inversed triangle pattern - very powerful :P

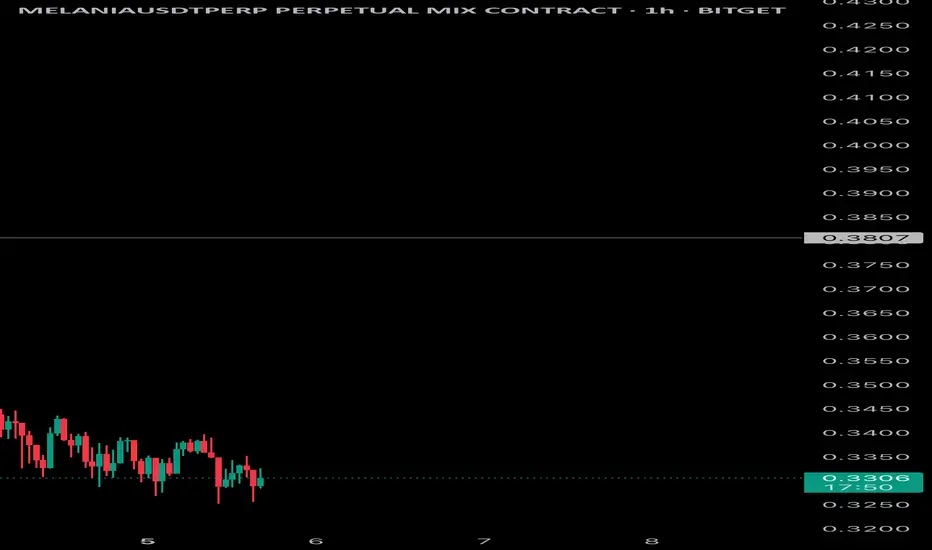
MELANIAUSD: Extended Downtrend + Accumulation at Key Support After a steep breakdown from the $0.3807 support, MELANIAUSDT has entered a prolonged period of low volatility and consolidation in the $0.32–$0.34 range. This type of price action often signals a potential accumulation phase following a capitulation move.
The price has failed to reclaim the previous key level at $0.3807, which now serves as strong resistance. However, sellers are showing signs of exhaustion, with each new low being marginal and quickly bought up.
I’m watching this zone closely for a volatility expansion — either a relief bounce toward $0.36–$0.38 or a breakdown to test the $0.30 psychological level.
Melani follows trumpSame pattern as trump. All you need is a good setup to find out how whales work. 7-star is the only indicator tailored to catch pumps like these.
for indicator access you can drop a message
DYOR


MELANIA Roadmap (4H)It seems that MELANIA is caught in a large bearish Diametric!
A meme coin left to the market!
It appears to be in wave D of this Diametric.
From the supply zone, we expect another rejection toward lower levels.
The closure of a daily candle above the invalidation level will invalidate this analysis.
For risk management, please don't forget stop loss and capital management
Comment if you have any questions
Thank You

MELANIA Hi,
It failed its first initial breakout, retested the trend and we are currently witnessing a move higher.
I have moved my SL to entry to make it a risk free trade while the FOMC is going ahead later today.

MELANIA MEME COIN TO THE MOON – 800% BY SUMMER 2025! Ladies and gentlemen, buckle up! Melania Coin is about to do what even Melania Trump couldn’t—stick around for the long haul. Experts (aka my cousin who trades from his mom’s basement) predict an 800% explosion by Summer 2025.
Why? Because logic doesn’t apply in meme land. Dogs had their run, frogs got their shine—it’s time for First Lady finance.
Technical analysis? It’s bullish.
Fundamentals? Who cares?
Vibes? IMMACULATE.
By 2025, you’ll either be sipping mojitos on a yacht or explaining to your friends why "just one more dip" was a bad idea. Choose wisely. 😂

MELANIA - Pennant Hi,
I am trading the potential pennant if we see a breakout to the upside.
Target is roughly $0.80. Entry would be $0.73.
GL if you join,

MELANIA Looks Bearish (1H)The situation with the meme coin MELANIA doesn't look good.
There is limited data available for this meme coin, but on the chart, 3 ABC waves of a pattern can be identified.
If wave C drops to the 0.618 or 0.786 Fibonacci levels of wave A, it may reach the specified targets on the chart.
The chart currently lacks a trigger for entering a position.
For a sell/short position, it's better to wait for the price to reach the red zone. For a buy/long position, we need to see reversal patterns along with confirmations.
For risk management, please don't forget stop loss and capital management
Comment if you have any questions
Thank You

MELANIA - TIME FOR PAYBACK!WHAT a RUG! Its not less than a rug! But play like the whales! Added 4hour chart where Ive marked a bottom green box where you can actually do buy it, till two stops, red and oranges!!

MELANIA coin from Top to BottomMELENIA coin from Top to Bottom
should we call this a big scam?
I hope you didn't get caught (loss to the coin) with this coin.

Official Melania Meme / MELANIAHello guys, this is my smart short idea.
Total supply: 999.99M MELANIA
Max. supply: 1B MELANIA
Circulating supply: 192.21M MELANIA
About Official Melania Meme
Melania memes are digital collectibles intended to function as an expression of support for and engagement with the values embodied by the symbol MELANIA. and the associated artwork, and are not intended to be, or to be the subject of, an investment opportunity, investment contract, or security of any type. melaniameme.com/ is not political and has nothing to do with any political campaign or any political office or governmental agency. See Terms & Conditions Here
The development so far doesn't look very positive.
I think in short, this go to bottom 1 usdt and maybe less!!
Possible move up from here around 4 usdt, 7 usdt.
New ath 40 usdt, long? that will never happen.
Good luck!
This is only my idea guys.
This is not financial advice !
Please do your analysis and consider investing !! Thanks

Bullish on $MELANIA1. We have MSS illustrated by the lightbulb icon
2. We have market respecting and finding support at the reclaimed orderblock
3. We have buyside draw and OTE OB- to reach
This is a mean reversion setup

MELANIA - Be MelancholyEQH is there means its going to hit up liqui shorts, but when they do this, you know what to do! Just dont blank longs!!!!!!!!! PLEASE!


#MELANIAUSDT further bearish movement!📉 SHORT BYBIT:MELANIAUSDT.P from $1.420
🛡 Stop Loss: $1.440
⏱ 1H Timeframe
✅ Overview:
➡️ BYBIT:MELANIAUSDT.P continues its bearish trend, failing multiple times to break above resistance $1.469.
➡️ POC at $1.469 indicates a strong liquidity zone, acting as resistance and reinforcing bearish pressure.
➡️ The price broke below $1.424, confirming further downside momentum.
➡️ The next key support level is $1.380, which is the primary target for this short setup.
⚡ Plan:
📉 Bearish Scenario:
➡️ Enter SHORT from $1.420 , as the price continues its decline.
➡️ Manage risk with Stop-Loss at $1.440 to protect against a potential reversal.
➡️ Main downside target:
🎯 TP Target:
💎 TP1: $1.380 — the nearest support level for profit-taking.
📢 If the price BYBIT:MELANIAUSDT.P remains below $1.424, the downtrend is likely to continue.
📢 However, a move back above $1.440 could invalidate the short setup.
🚀 BYBIT:MELANIAUSDT.P Expecting further bearish movement!

Trump Melania #TRUMP #MELANIA #MEMES va deep have gotten the trumps in a few weeks, only memes, always at the end when there is no solid project and only by FOMO people join the wave, they pass these things they take liquidity and many people losing their money, that's why we recommend analyzing, projecting and seeing what profit the CURRENCY has where it is going to invest, Now if you plan to speculate with the price fluctuation you should know before entering the risk involved. 🛑 🆘

TRUMP vs MELANIA! Dont do the same mistake!Tired of getting liquidated when melania coin plays with you with a dead cat bounce? Change stances do shorts till 0.950 to 0.750! What a day what a hype! Trump is just getting ready to get some buyers, expecting a hyped move to $35 to fall to $10 lol! Just mark my words here!
