Magic Eden’s ME Token Eyes Bounce After Trump Wallet VolatilityOn June 3, , Magic Eden ( BINANCE:MEUSDT ) announced a collaboration with a project called to launch a new" Trump Wallet "
This announcement triggered a + 35% price increase , pushing the price of ME Token to approximately $1.17 .
However, shortly afterward, members of the Trump family, inclu

Me !!!The price on the daily timeframe is within a triangle, which can create some uncertainty about which direction it will move. Here, we should wait to see which side of the triangle the price breaks out from. Remember, the trend is our friend.
Best regards CobraVanguard.💚

MEUSDT 1D AnalysisME ~ 1D Analysis
#ME This trade is very high risk
Buy gradually from here with a short term target of at least 15%+ from here.

ME Likely to Revisit 1.415 ZoneBased on the MissedPrice concept, rapid price moves often skip levels that price later revisits. The 1.415 level shows an Open Interest leap, suggesting missed positions.

MEUSDT 1D AnalysisME ~ 1D Analysis
#ME This trade is very high risk
Buy from here if you still have a Conviction on this coin with a short -term target of at least 10%+.

MetaUnit | Long Entry signal for MEU/USDT Analysis:
MLR > SMA: The MLR (blue) is above the SMA (pink), signaling a bullish trend.
MLR > BB Center: MLR exceeds the Bollinger Bands Center Line (orange), showing strong bullish momentum.
PSAR: PSAR dots (black) are below the price, reinforcing the uptrend.
No SMA 200: SMA 200 unavailable - p

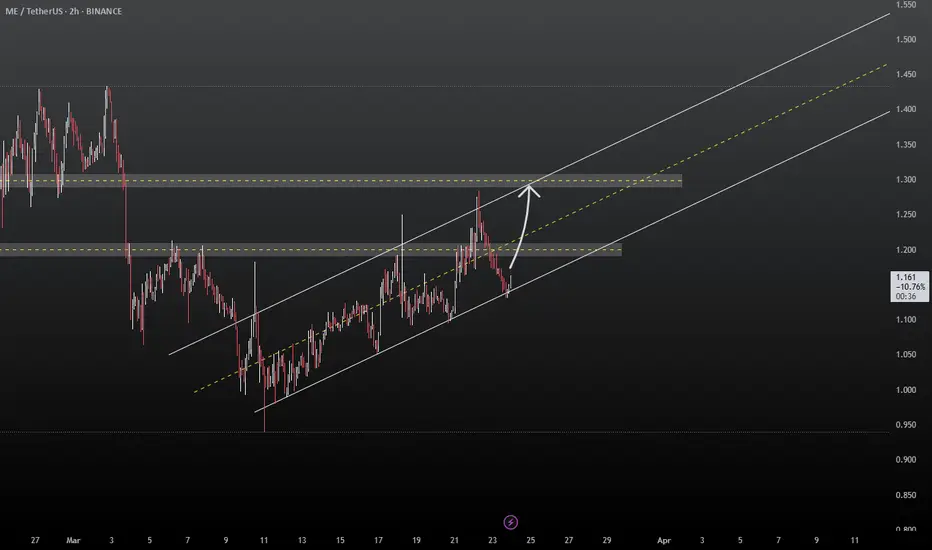
MEUSDT: Ascending Channel - Is $1.300 the Next Stop?Fellow traders!
MEUSDT is exhibiting classic ascending channel behavior. Having tested the lower channel boundary, the price is likely to advance towards the upper channel boundary, with a potential target near $1.300.
Implement prudent risk management.
BINANCE:MEUSDT
MEUSDT Ready to Explode or Another Bull Trap?Yello, Paradisers! Are we about to witness a strong bullish reversal on MEUSDT, or is another trap being set? Let’s break it down.
💎MEUSDT has formed a well-structured ending diagonal with a clear 5-wave pattern, increasing the probability of an upcoming bullish move. Additionally, the inverse head

Magic Eden: Looks Promising (1,050% Potential Revealed/Mapped) This is a short-term chart but I don't care. It is very clear that MEUSDT (Magic Eden) broke out of a major downtrend. This downtrend was active since last December 2024.
Good afternoon living Spirit, how are you feeling now?
Notice the blue lines on the chart, a falling wedge pattern.
The upper l

MEUSDT Falling Pattern Breakout with 200%-250% Potential GainsMEUSDT has recently broken out of its Falling Pattern, signaling the potential for a strong price rally. A Falling Pattern often sets the stage for a reversal, and with the breakout now complete, MEUSDT is poised to enter a bullish phase. The pattern, which typically consists of lower lows and lower

See all ideas
Summarizing what the indicators are suggesting.
Oscillators
Neutral
SellBuy
Strong sellStrong buy
Strong sellSellNeutralBuyStrong buy
Oscillators
Neutral
SellBuy
Strong sellStrong buy
Strong sellSellNeutralBuyStrong buy
Summary
Neutral
SellBuy
Strong sellStrong buy
Strong sellSellNeutralBuyStrong buy
Summary
Neutral
SellBuy
Strong sellStrong buy
Strong sellSellNeutralBuyStrong buy
Summary
Neutral
SellBuy
Strong sellStrong buy
Strong sellSellNeutralBuyStrong buy
Moving Averages
Neutral
SellBuy
Strong sellStrong buy
Strong sellSellNeutralBuyStrong buy
Moving Averages
Neutral
SellBuy
Strong sellStrong buy
Strong sellSellNeutralBuyStrong buy
Displays a symbol's price movements over previous years to identify recurring trends.
Related pairs
Frequently Asked Questions
The current price of MAGIC EDEN / TETHER (ME) is 0.908 USDT — it has fallen −1.21% in the past 24 hours. Try placing this info into the context by checking out what coins are also gaining and losing at the moment and seeing ME price chart.
MAGIC EDEN / TETHER price has risen by 6.16% over the last week, its month performance shows a −23.87% decrease, and as for the last year, MAGIC EDEN / TETHER has decreased by −77.30%. See more dynamics on ME price chart.
Keep track of coins' changes with our Crypto Coins Heatmap.
Keep track of coins' changes with our Crypto Coins Heatmap.
MAGIC EDEN / TETHER (ME) reached its highest price on Dec 10, 2024 — it amounted to 22.631 USDT. Find more insights on the ME price chart.
See the list of crypto gainers and choose what best fits your strategy.
See the list of crypto gainers and choose what best fits your strategy.
MAGIC EDEN / TETHER (ME) reached the lowest price of 0.708 USDT on Apr 7, 2025. View more MAGIC EDEN / TETHER dynamics on the price chart.
See the list of crypto losers to find unexpected opportunities.
See the list of crypto losers to find unexpected opportunities.
The safest choice when buying ME is to go to a well-known crypto exchange. Some of the popular names are Binance, Coinbase, Kraken. But you'll have to find a reliable broker and create an account first. You can trade ME right from TradingView charts — just choose a broker and connect to your account.
MAGIC EDEN / TETHER (ME) is just as reliable as any other crypto asset — this corner of the world market is highly volatile. Today, for instance, MAGIC EDEN / TETHER is estimated as 4.50% volatile. The only thing it means is that you must prepare and examine all available information before making a decision. And if you're not sure about MAGIC EDEN / TETHER, you can find more inspiration in our curated watchlists.
You can discuss MAGIC EDEN / TETHER (ME) with other users in our public chats, Minds or in the comments to Ideas.