MEW : A meme coin that hasn't grown yetHello friends🙌
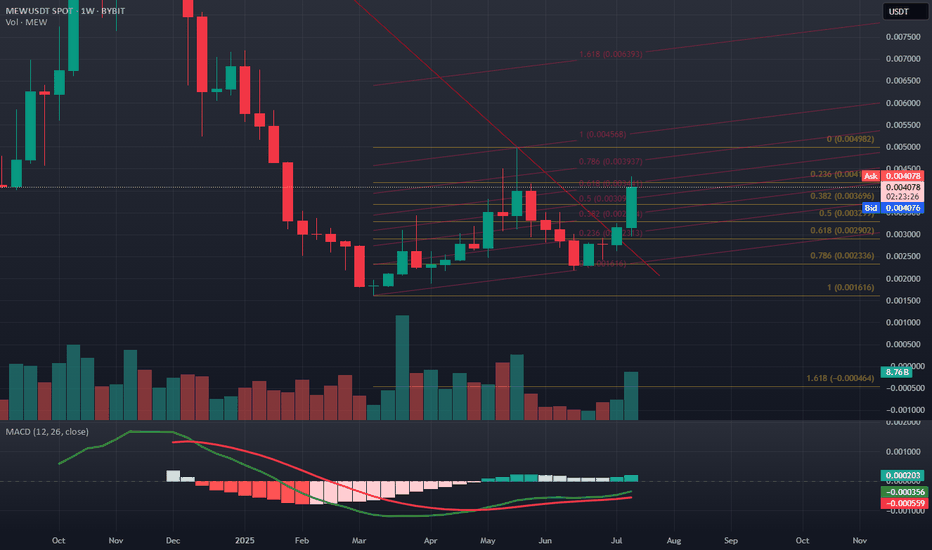
Given the decline we had, you can see that buyers entered the specified support area and entered the price into the ascending channel. That is why we can buy with risk and capital management and stay with it until the specified targets.
🔥Follow us for more signals🔥
*Trade safely w
Related pairs
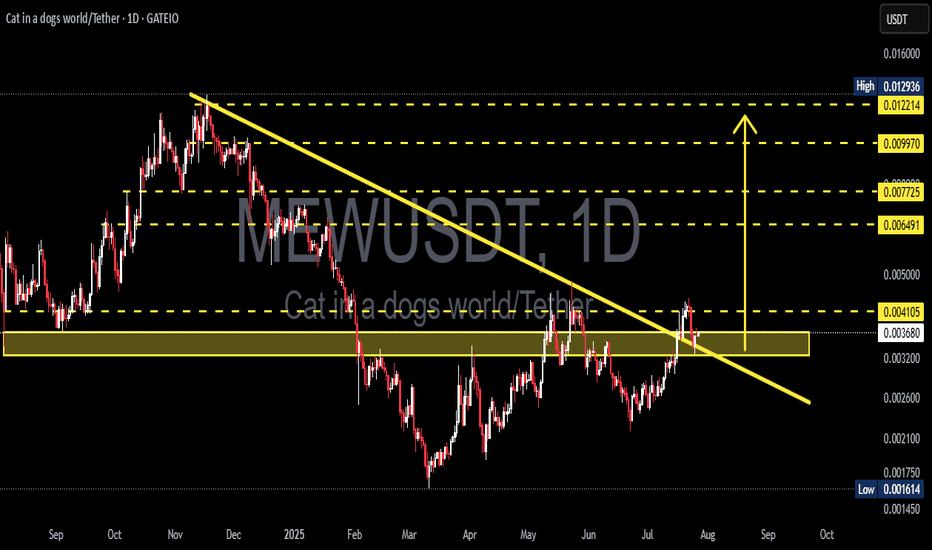
MEWUSDT Breakout! Rounded Bottom Reversal and Key Retest Zone!MEWUSDT has officially broken out of a long-term descending trendline that has capped price action since December 2024. The formation of a Rounded Bottom (Cup) suggests a strong accumulation phase and potential for trend reversal. The current retest of the breakout zone will be crucial in determinin
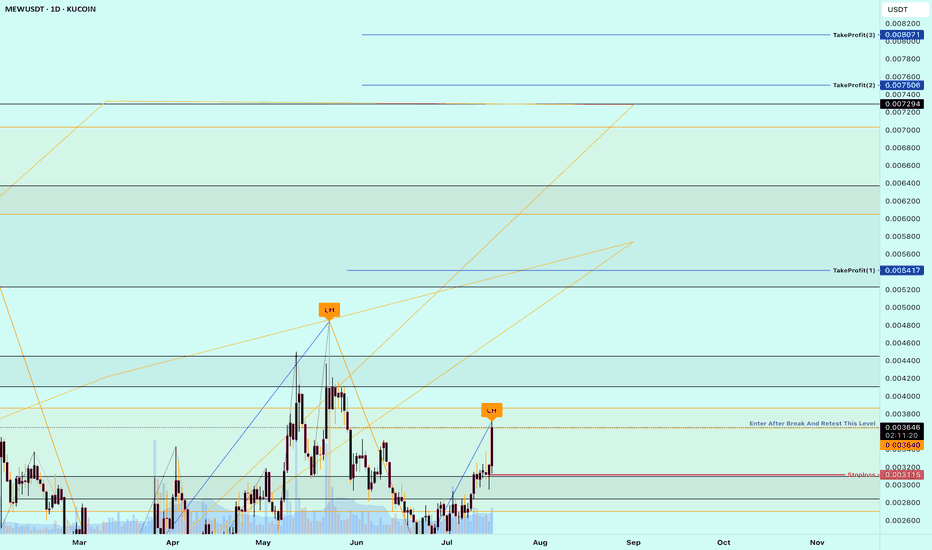
Buy Trade Strategy for MEW: Tapping Into the Meme Economy SurgeDescription:
This trading idea focuses on MEW, a rising star in the meme coin category that’s capturing community attention through strong online engagement and viral appeal. Unlike traditional cryptocurrencies, MEW leverages the power of internet culture and social media dynamics to drive visibili
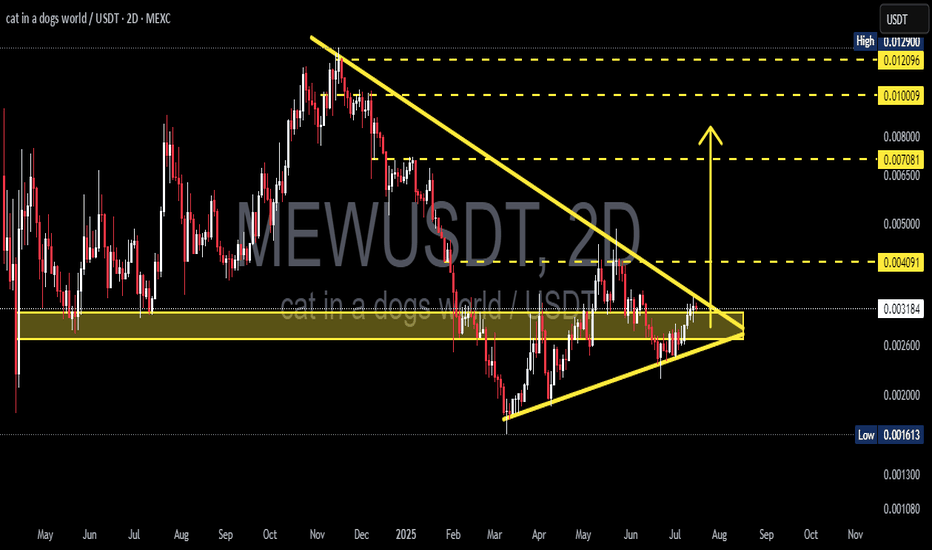
MEW/USDT Ready to Explode? Major Breakout from Symmetrical!After weeks of tight consolidation, MEW/USDT is showing signs of a major breakout from a well-formed Symmetrical Triangle pattern on the 2D time frame. This could mark the beginning of a powerful expansion phase if confirmed by volume and price action.
🔍 Pattern Analysis & Technical Structure
Mai
MEW Main Trend. Memcoin. 2025 07 02Logarithm. Time frame 3 days.
Cat in a dogs world (MEW)
X -133 thousand subscribers (this is not enough).
Reduction from the maximum -87%. For such assets, this is not enough.
I imposed a descending channel on the chart (current descending trend of the main trend), and a horizontal one, if by some
MEW Looks Bliish (4H)An important trendline has been broken, and the price has pulled back to it. Within the internal structure of the pullback, a bullish iCH has also formed.
During minor pullbacks, it’s possible to look for buy/long positions on the MEW pair.
A daily candle closing below the invalidation level would
MEW Sell/Short Setup (4H)We have a supply zone from which a strong drop has previously formed. This zone has been tested once already, but with only minimal penetration. Given this shallow penetration and the price’s inability to make a lower low, we are once again expecting a potential short position from this zone.
We’re
#MEWUSDT - Recovered after the sell-off, is the drop coming? Hey folks! 🚀
Today, we’re diving into the analysis of a highly volatile coin. Our special guest for the day: #MEWUSDT.P! 🔥
Looking at the #MEWUSDT chart, we saw a sharp pullback from $0.00300 after facing strong selling pressure, dropping all the way down to $0.0026. Right now, it's making a corre
See all ideas
Summarizing what the indicators are suggesting.
Oscillators
Neutral
SellBuy
Strong sellStrong buy
Strong sellSellNeutralBuyStrong buy
Oscillators
Neutral
SellBuy
Strong sellStrong buy
Strong sellSellNeutralBuyStrong buy
Summary
Neutral
SellBuy
Strong sellStrong buy
Strong sellSellNeutralBuyStrong buy
Summary
Neutral
SellBuy
Strong sellStrong buy
Strong sellSellNeutralBuyStrong buy
Summary
Neutral
SellBuy
Strong sellStrong buy
Strong sellSellNeutralBuyStrong buy
Moving Averages
Neutral
SellBuy
Strong sellStrong buy
Strong sellSellNeutralBuyStrong buy
Moving Averages
Neutral
SellBuy
Strong sellStrong buy
Strong sellSellNeutralBuyStrong buy
Displays a symbol's price movements over previous years to identify recurring trends.
Frequently Asked Questions
The current price of MEWUSDT SPOT (MEW) is 0.002998 USDT — it has risen 2.70% in the past 24 hours. Try placing this info into the context by checking out what coins are also gaining and losing at the moment and seeing MEW price chart.
MEWUSDT SPOT price has fallen by −17.68% over the last week, its month performance shows a 6.56% increase, and as for the last year, MEWUSDT SPOT has decreased by −46.42%. See more dynamics on MEW price chart.
Keep track of coins' changes with our Crypto Coins Heatmap.
Keep track of coins' changes with our Crypto Coins Heatmap.
MEWUSDT SPOT (MEW) reached its highest price on Nov 17, 2024 — it amounted to 0.012943 USDT. Find more insights on the MEW price chart.
See the list of crypto gainers and choose what best fits your strategy.
See the list of crypto gainers and choose what best fits your strategy.
MEWUSDT SPOT (MEW) reached the lowest price of 0.001616 USDT on Mar 11, 2025. View more MEWUSDT SPOT dynamics on the price chart.
See the list of crypto losers to find unexpected opportunities.
See the list of crypto losers to find unexpected opportunities.
The safest choice when buying MEW is to go to a well-known crypto exchange. Some of the popular names are Binance, Coinbase, Kraken. But you'll have to find a reliable broker and create an account first. You can trade MEW right from TradingView charts — just choose a broker and connect to your account.
Crypto markets are famous for their volatility, so one should study all the available stats before adding crypto assets to their portfolio. Very often it's technical analysis that comes in handy. We prepared technical ratings for MEWUSDT SPOT (MEW): today its technical analysis shows the sell signal, and according to the 1 week rating MEW shows the sell signal. And you'd better dig deeper and study 1 month rating too — it's sell. Find inspiration in MEWUSDT SPOT trading ideas and keep track of what's moving crypto markets with our crypto news feed.
MEWUSDT SPOT (MEW) is just as reliable as any other crypto asset — this corner of the world market is highly volatile. Today, for instance, MEWUSDT SPOT is estimated as 5.65% volatile. The only thing it means is that you must prepare and examine all available information before making a decision. And if you're not sure about MEWUSDT SPOT, you can find more inspiration in our curated watchlists.
You can discuss MEWUSDT SPOT (MEW) with other users in our public chats, Minds or in the comments to Ideas.


