Still Waiting for Support areas!A fake breakout make most Mew fans seller!
Market maker will buy in deep and users stop losses will active!
Then Pump will start! This is the plan!
MEWUSDT trade ideas

MEW — Another Unsuccessful Break Out Attempt!
After its latest pump in mid-July, MEW has entered a bull flag pattern. Moreover, we've seen a couple of breakout attempts—so far, all unsuccessful.
Just yesterday, we had the next attempt, which was also driven by an enormous volume spike. However, the resistance remained strong, and MEW was rejected. Even today, MEW tried to push but didn't reach the trend line.
Once MEW manages to breakout to the top, we could quickly see a rally of 60% (calculated based on the previous pole flag). Accordingly, a level of 0.012 is possible.
However, an entry should be based on a breakout and confirmation on a higher timeframe. A stop loss can be placed slightly below the trend line.

mew longIt has been lowered to test the support range. You can purchase step by step for further purposes BINANCE:MEWUSDT.P KUCOIN:MEWUSDT GATEIO:MEWUSDT

MEW: Buy or Wait?The trading volume is 51.691M MEW, indicating significant market activity.
The SMA is at $0.007526, indicating that the current price is slightly above the moving average, which can be a bullish sign.
The histogram value is 0.000062, MACD line is 0.000107, and the signal line is 0.000046, indicating a bullish trend.
%K at 79.62 and %D at 79.77, indicating the asset is near overbought conditions.
The RSI stands at 64.19, suggesting that MEW is approaching overbought conditions but still has room for growth.
Market Sentiment
The market sentiment for MEW appears cautiously optimistic. While the RSI and Stochastic Oscillator indicate nearing overbought conditions, the MACD suggests bullish momentum.
Potential Market Scenarios
Bullish Scenario:
A decisive break above the local resistance at $0.008816 could lead to further upward movement, targeting higher resistance levels.
Bearish Scenario:
If MEW fails to break above the local resistance, it could retest the support levels at $0.007538 and $0.007051. A break below $0.007051 could signal further declines.
When to Buy MEW for Investment
Current Situation:
Given MEW's current price at $0.007959 and the technical indicators suggesting potential overbought conditions, a cautious approach is warranted.
Optimal Buying Strategy:
Wait for a Pullback: Considering the Stochastic Oscillator and RSI indicating near overbought conditions, waiting for a pullback towards the local support level at $0.007538 could offer a better entry point.
Solid Support Level : If the price drops further, the solid support at $0.007051 is a strong level to consider for investment. Historically, MEW has found significant buying interest at this level, making it a safer entry point.
Gradual Accumulation: Alternatively, adopting a dollar-cost averaging (DCA) strategy by buying small amounts at regular intervals can mitigate the risk of market timing and take advantage of potential dips.
Conclusion and Market Outlook
MEW is currently positioned with significant support and resistance levels to watch. While technical indicators suggest potential overbought conditions in the short term, the bullish MACD and overall market activity suggest room for growth.
Impact of Bitcoin:
It's essential to note that Bitcoin (BTC) is currently at a crucial level. If BTC fails to surpass its all-time high and experiences a significant drop, it could negatively impact the broader cryptocurrency market, including MEW. Monitoring BTC's price action is vital for understanding potential risks to MEW's price movements.

MEWUSDT.P LONGMEWUSDT LONG
Entry : 0.006660/ 0.0067
Leverage : Cross X20
Stop loss : 3.5%
Targets : 0.007328/ 0.007755/ 0.008140
Capital invested : 1%

MEW forming an Symmetrical Triangle PatternMEW making her ready for the last wave to go down of symmetrical triangle. If it hits support then I expect MEW to go up and then wait for a breaktrough of the Resistance area.
If we have a succesfull breakout MEW can go up atleast 70%.
What are your thoughts?
Always DYOR this is no financial advice.


MEWUSDT / I'm buying more here for high profitThe price reaches an important support level and is bullish.
Risk warning and disclaimer...!

MEW — Ready To Get Rid Of A Zero?After its recent pump of more than 100%, cats in a dogs world is consolidating in a bull flag. Since the bull flag is a continuation pattern, chances are high that we will see a breakout to the top.
Based on the bull flag pole, a break-out should aim for a target above 0.012 and erase one 0.
How to trade?
Trading the bull flag requires the price to break out to the upside. Additionally, it is preferable to confirm the breakout on a higher timeframe, like the daily chart, before entering a trade.
If you want to reduce the risk, you can even wait for a re-test after the breakout—however, this doesn't always happen, and it can also lead to a missed trade.

MEWUSDT.P - SHORTBOS formed i'll go short from the OTE Mention as it has to retest before heading down hopefully we get filled there if not then moving on to next one cheers!

Huge comeback for $MEW!Cat-themed coins are dominating the charts!
MEW is one of the top CAT meme coins, along with POPCAT . These coins have been showing strong performance.
With all this momentum, I believe we’ll see a new ATH for MEW soon.
Chart looks primed though we need .008 to hold (VAH)
If .008 breaks, the level I'm watching is .0077 to .0073 for potential long, targeting .0093 to .010 (short-term)

cat in a dogs world MEW memecoinMemecoin #MEW ... 😱
1️⃣ On the one hand, it looks like all the coins are unlock, and the price has entered the liquidity zone, and the meme is on #Solana (it's a trend that memes are pumped on $Solana...)
2️⃣ And on the other hand, the altos are so easy to fall that the price of #MEWUSDT can fall in the range of $0.00314-0.00344 in just a few candles
Observe or take risks - it's up to you

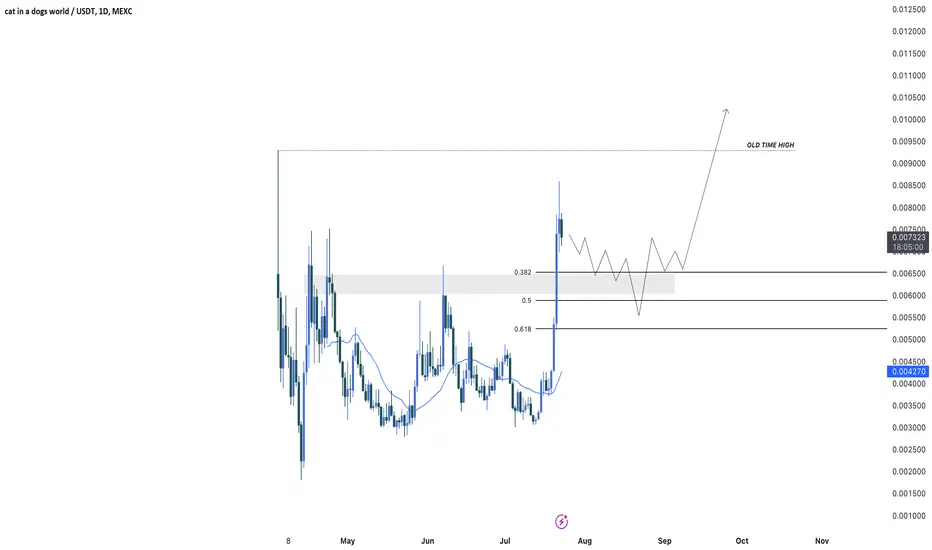
Is it time for MEW to break its all-time high?MEW meme coin is showing impressive upward price action. 🚀 I believe it's getting close to breaking its all-time high. Before that, I’ll wait for a retracement on the daily timeframe. Once it hits the 50% or 62% Fibonacci levels, I'll look for a long position. 📈
MEW Update (Bullish)This symbol is one of the symbols of the Solana network.
It looks like we have an ABC pattern on the chart.
Wave B looks like a triangle that has ended.
By fixing on the red box, it can move up to ATH.
A daily candle close below the red box will violate the move towards the ATH
For risk management, please don't forget stop loss and capital management
Comment if you have any questions
Thank You

MEW analysis (6H)It seems that a large pattern (triangle or diametric) is forming, and we are now in wave D of this pattern.
The D wave pattern can have several scenarios, but a supply and demand range can be determined for MEW.
In the demand range, we can look for buy/long positions
Closing a daily candle below the invalidation level will violate the analysis.
For risk management, please don't forget stop loss and capital management
Comment if you have any questions
Thank You

MEWUSDT / I'm buying moreThe price reaches an important support level and is bullish.
Risk warning and disclaimer...!

MEWUSDT/I'm buying moreThe price reaches an important support level and is bullish.
Risk warning and disclaimer...!


MEW - MEME COIN PUMP COMING SOON We can see a big move in this meme coin, so keep an eye on this project.
Meme coins are very risky so don't invest your full money in this type of coins.

moving towards the next resistanceMEW has significant support at $0.0040 area. This strong support level suggests that buyers are likely to step in at these prices, which could prompt a move towards the next resistance levels at $0.0050. Given this setup, it is worth keeping MEW on your watchlist.


#mewusdt ( two possible pattern )The ascending pattern of Adam and Eve is evident in the chart, but
it is not certain until it hits the edge
Another possible pattern is the inverted head and shoulders (yellow pattern), which must break the black neckline firmly to be definitive.
So, two good upward patterns can be observed at the moment, but it is not certain at the moment.

MEWUSDT AnalysisOverview:
This chart analysis for MEWUSDT highlights key zones for scaling in and out using Fibonacci retracement levels and Elliott Wave principles.
Key Tips:
Identifying Wave 1 and Wave 2:
The initial price spike represents Wave 1.
The corrective decline retracing to the 0.786, in crypto sometimes to 0.88 Fibonacci level marks Wave 2, suggesting a potential buying opportunity.
Scaling In:
Enter positions within the "scaling in" zone around the 0.786 retracement level, which often acts as a strong support in Wave 2.
Scaling Out:
Target profits within the "scaling out" zone, aligned with Fibonacci extension levels (1.0, 1.236, 1.382, 1.5). This area likely represents the peak of Wave 3 or beyond.
Stop Loss:
Place stop losses just below the 0.88 Fibonacci levels to manage downside risk.
Conclusion:
Utilizing Fibonacci levels for scaling in and out, combined with Elliott Wave analysis, can provide structured entry and exit points. Always consider risk management to protect against unexpected market movements.
