$MICHI Set for 1400% Leap Amidst Historic Falling wedge PatternThe Solana-based memecoin $MICHI is showing strong signs of a potential 1400% rally, with its price action forming a historic falling wedge pattern—a setup that has previously led to massive breakouts. As market conditions align for a bullish reversal, investors are keeping a close eye on $MICHI's next move.
Technical Analysis
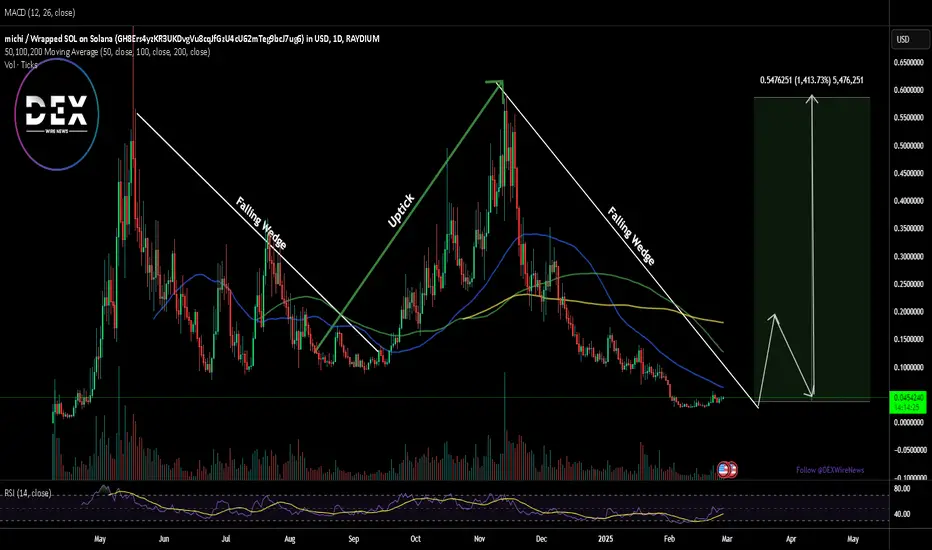
A falling wedge pattern is often a bullish reversal indicator, and $MICHI has repeatedly followed this pattern before making parabolic moves. Currently, the token is trading below key moving averages, creating room for a sharp recovery. With an RSI of 49.28, $MICHI is nearing neutral territory, indicating that selling pressure has eased, and a breakout could be imminent.
If this pattern plays out as expected, the memecoin could revisit its all-time high (ATH) of $0.57, marking a staggering 1400% surge from current levels.
Final Thoughts:
All indicators suggest that $MICHI is primed for a major move. With a well-established pattern, key technical indicators aligning, and strong fundamentals backing it, the stage is set for a potential bullish breakout. However, as always, traders should monitor key resistance levels and overall market sentiment before making a move.
MICHIUSD trade ideas
#MICHI USDT#MICHIUSDT
Buying some Michi at these levels as it is very crucial support for it.
We have seen it bouncing from here couple of times already.

$michi - bouncing back and bullish uptrend$michi already broke $0.24 resistance and next leg up resistance is $0.32, when $0.32 turns from resistance over to support from retest(s), then it should break all time high from there before Q4 2024.
My target for $michi is $1 billion market cap by end of year 2024.

$michi bottom in bottom box. Won’t be long$michi more chop in this box, likely hit $0.123 before blastoff to the long awaited number $1

Don't Fade This...Cat meta is coming and fomo will take over - watch multiple cat meme coins run into the billions.
