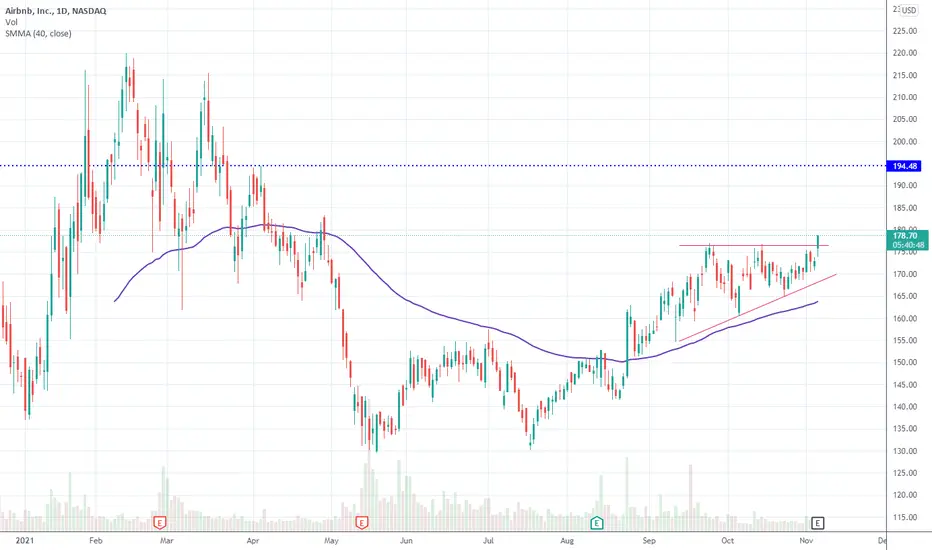
ABNB: Bullish OutlookTechnically I like the price action for ABNB, despite it sitting in a supply zone. Difference between now and in the past is the momentum is confirming the move. Some may look at Zillow and base that decline and sentiment as an overlay onto the rental property business - but I think they're not as correlated as many speculate.
Bullish outlook on ABNB with targets identified into the upper supply zone.
1ABNB trade ideas

$ABNB Little breakoutTarget for this breakout $194, but I consider this share a long term hold. Industry disruptor
ABNB resting at good trend lineABNB is resting at good long trendline and with ER planned on 11/04, it can break the resistance line to go higher

Airbnb will experience higher volatility soon..!In 1 week there will be the earnings, ABNB is at the lower border of an upward regression channel and also has built a contracting triangle (consolidation pattern) its earning will push Airbnb outside the consolidation!
the question is which side is more probable?
Because of the Delta variant surge, I do not think tourism-related stocks could beat the expectation..!
But as I always said, trading before earnings= gambling!
and I prefer to stay out of it!
Best,
Moshkelgosha
DISCLAIMER
I’m not a certified financial planner/advisor nor a certified financial analyst nor an economist nor a CPA nor an accountant nor a lawyer. I’m not a finance professional through formal education. The contents on this site are for informational purposes only and do not constitute financial, accounting, or legal advice. I can’t promise that the information shared on my posts is appropriate for you or anyone else. By using this site, you agree to hold me harmless from any ramifications, financial or otherwise, that occur to you as a result of acting on information found on this site.

$ABNB will be $181.00 by Dec 2nd -Fib flag formation So I did two fib growth pitchforks..
—one mod schiff Bearish and one original recipe bullish, and that’s an obvious flag formation, double major resistance at $180 to $182
If I was a betting man I would bet a debit call spread with the short call 60+ days out 12/15/21 on the top end w a $190 strike..
-and a slightly out of the money call January 2022 at $175 strike.. Cha Ching!

$ABNBAn essential aspect of Airbnb's business is that the company does not own or operate any rental properties. Similar to eBay, it creates the platform and manages the interactions between hosts and guests. The asset-light business model has the potential for excellent profit margins because there is no need to pay for building or maintaining expensive structures like hotels or resorts. Moreover, Airbnb can hire customer service staff in low-cost parts of the world to support guests staying at properties in high-cost areas like Los Angeles.
The coronavirus pandemic caused Airbnb's revenue to fall by 29.7% in fiscal 2020. Before the outbreak, Airbnb increased revenue by 42.6% and 31.6% in 2018 and 2019, respectively. Overall revenue was highest in 2019, where it totaled $4.8 billion. Still, management feels that's just the tip of the iceberg. It estimates Airbnb's total addressable market at around $3.4 trillion.
To put that figure into context, Statista estimates the worldwide hotel and resort market peaked at $1.47 trillion in 2019. It seems management's estimate of its total addressable market may be on the optimistic side.
Airbnb I’ve been very bullish on before it even went public.
It has a slight rough start to the year but it seems to have found its step.
It had a clear double bottom on the daily and now is following a nice upwards trend and is now currently sitting at support
Implying, if Airbnb is able to hold these prices we could see this continue it’s way up and with earnings around the corner it would be very interesting to see what happens from here.
MACD flat.
RSI below 50.
Watchlist this.
Factor Four

ABNB Possible Breakout at Earnings Earnings could be the catalyst we need to break out above 175. I don't think the 4th is a coincidence. Very Bullish. Let me know your thoughts below.

Symmetrical Triangle - Watching closelyABNB forming a big symmetrical triangle but frankly looking quite bullish, will be looking for a breakout from this triangle (Broader Markets Permitting) - Just some support and resistance levels to keep an eye on along with some RSI-based supply and demand zones
- Sitting right on its 20-day EMA
- Bollinger Bands Squeezing (Not Pictured)
- Slight bullish hidden divergence on the RSI
- MACD cross on the hourly timeframe (See Chart Below)
PT1- $171.21
PT2- $172.46
PT3- $175.67 + Breakout

Liking this Ascending Triangle forming on ABNB.Liking this Ascending Triangle forming on ABNB.
Going to wait until earnings first to see what happens but could be a good one!

$ABNB Setting up a Breakout Trade$ABNB doing all the right things
* Volume drying up
* Candles tighting up
* Vol pattern looks solid
* Few more days below that supply line (orange bars) and this will turn into a very nice looking setup
Simple Daily analysis The chart says it all, shorter term down and longer term up. Don't over complicate thing.

ABNB swing/day trade ideaNASDAQ:ABNB Potential 3 bar play on the daily. Price holding demand zone... 3 target profits... locked in some profits along the way
Call 172.5 strike exp Oct 29

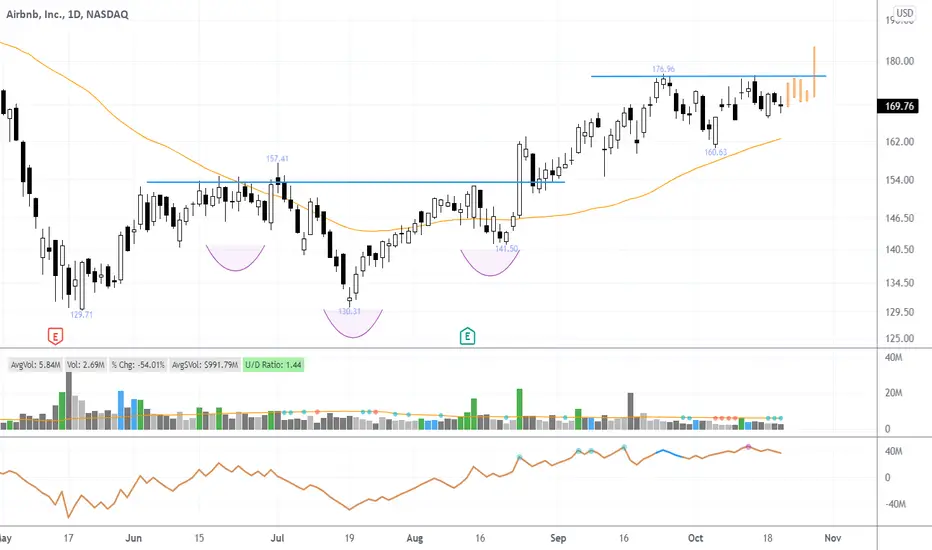
AIRBNB (ABNB) Trade UpdatesUpdate on AIRBNB investment made in August.
After my entry (at 144,71 see the previous post), a rather solid uptrend started.
We are now on a very important volumetric level; a small double bottom has also been created, so a slight pull-back in the short term could be physiological. It is important to see if the 200 moving average will hold, given that the company's listing is a recent thing, the second support to keep in mind is the trendline I have drawn.
The most important thing to point out is the relative strength of the company; in a difficult period for the general markets, ABNB only rose in the months of September and October. This is an important signal of strength, as is the awareness that the world is slowly starting up again and so is Airbnb, closely linked to tourism.
Let's remember that from March 2021 to May 2021 the stock had lost 40%! An enormity, clearly due to external events (COVID and tourism paralysis) rather than to company problems, which, on the contrary, has solid foundations.
I remind you that mine is a long-term investment perspective with gradual accumulation with each pullback, for those interested in pure trading, the targets for a take profit in my opinion are:
- $ 180
- $ 190 important volumetric level where the institutions have started to push the price down
- $ 215 very close to an all-time high, an area where I will take home part of the profits.
Pay attention to the earnings at the beginning of December.
Happy trading
Lazy Bull
DISCLAIMER: I am not a financial advisor nor a CPA. These posts, videos, and any other contents are for educational and entertainment purposes only. Investing of any kind involves risk. While it is possible to minimize risk, your investments are solely your responsibility. It is imperative that you conduct your own research. I am merely sharing my opinion with no guarantee of gains or losses on investments.


ABNB Bullflag?At the trendline of a bull flag
if market cooperates today, we might see a break, otherwise this can go low to retest the bottom of the flag
Either way i am watching this (favoring upside)

Airbnb Long Airbnb looks like it is in a nice uptrend. It's getting close to a major resistance that could become support for it.


ABNB: Double bottom base target at 177The stock reached the 177 target measured from the double bottom base (130-153). This is also the 50% retracement of the 220 to 130 downswing. The stock could potentially consolidate before resuming the upswing.


AirBNB - ABNB - Still in uptrend!AirBNB - ABNB - Still in uptrend! There is not much price action history but ABNB is moving smoothly based on the trend lines. Edutainment Purposes Only!

ABNB: RECOVERY PLAY, ICHIMOKU ANALYSISABNB :
Another reopening play, people looking to travel again.
Ichimoku analysis on daily:
The price is currently blocked by the cloud. Pressure is building to reintegrate the cloud.
The lagging span (green line) has broken the Tenkan (blue line) and is heading for a test of the Kinjun (dark red line), the flat zone of the Kinjun is our 1st target/resistance at 156 (providing the price can reintegrate the cloud).
This is what I'm playing now with a long trade.
The next step will be for the price to reach the top of the clouds (and maybe break out of it) and the lagging span to break the Kinjun, confirming the change of trend.
Note how Ichimoku is precise, all flat zones (of clouds and Laggin span) represent former supports and resistances (the 4 targets on the chart).
On a separate note you can see a sort of ascending triangle on the daily chart.
Trade safe!
More on Ichimoku (by Investopedia):
The Ichimoku Cloud is a collection of technical indicators that show support and resistance levels, as well as momentum and trend direction. It does this by taking multiple averages and plotting them on a chart. It also uses these figures to compute a “cloud” that attempts to forecast where the price may find support or resistance in the future.
Key takeaways:
The Ichimoku Cloud is composed of five lines or calculations, two of which comprise a cloud where the difference between the two lines is shaded in.
The lines include a nine-period average, a 26-period average, an average of those two averages, a 52-period average, and a lagging closing price line.
The cloud is a key part of the indicator. When the price is below the cloud, the trend is down. When the price is above the cloud, the trend is up.
The above trend signals are strengthened if the cloud is moving in the same direction as the price. For example, during an uptrend, the top of the cloud is moving up, or during a downtrend, the bottom of the cloud is moving down.


