ADBE Wave 5 failurePrice could fail and do a double top or a fake out top then correct
That's how I see it, I'm no expert in E.W though, but only time can tell
Let's see
1ADBE trade ideas

Adobe's stock has risen by 4 small bandsAdobe's stock has risen by 4 small bands
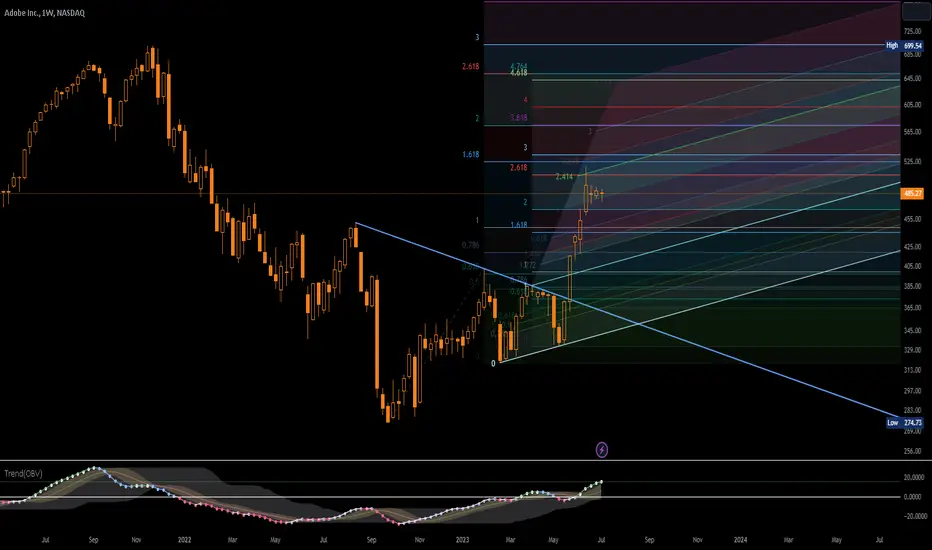
This chart shows the weekly candle chart of Adobe's stock in the past two years. The top to bottom golden section at the end of 2021 is superimposed in the figure. As shown in the figure, Adobe's stock has risen by 4 small bands since the short-term bottom formation at the end of September 2022, and the bull momentum has been perfectly released! The recent peak of Adobe's stock has just peaked at the top to bottom golden ratio of 1.618 in the picture, and now it has fallen back to 2.000! In the future, the top to bottom golden ratio of 2.382 in the figure will serve as the long short divide for Adobe's stock!

Rising WedgesThe most recent Rising Wedge (top wedge) was broken but price quickly recovered.
There is another RW below this one that is not valid as the bottom line has not been broken.
Price broke up and out of this wedge.
Rising wedges interrupt supply and demand causing too much supply inside the wedge.
Both lines slope up and converge at the apex.
No recommendation.

$ADBE in consolidation areaNASDAQ:ADBE in consolidation area , a pullback to the gap fill one can imagine to have a cup and handle forming. if this critical level breaks then if a retest is successful then a push to 600s is possible

ADOBE: $307 up (+147,000%) Doing Nothing since Day a superior product inspired by XEROX PALO (PARC) R&D in 1970
come 1982 (12 years later) ADOBE was born
come 1986 (4 years later) adobe got listed at $0.21 cents
since then it rewarded early believers to (144,000%) for 33 years
thats a CAGR of (+4,300%) yearly yiled with an upward correction of -60%
up until todate where are media are becoming in demand to post millennial generartion
--
MSOFT Microsoft listed around the same time @ $0.09 cents now spot $152 up (+168,000%)
also inspired by PARC

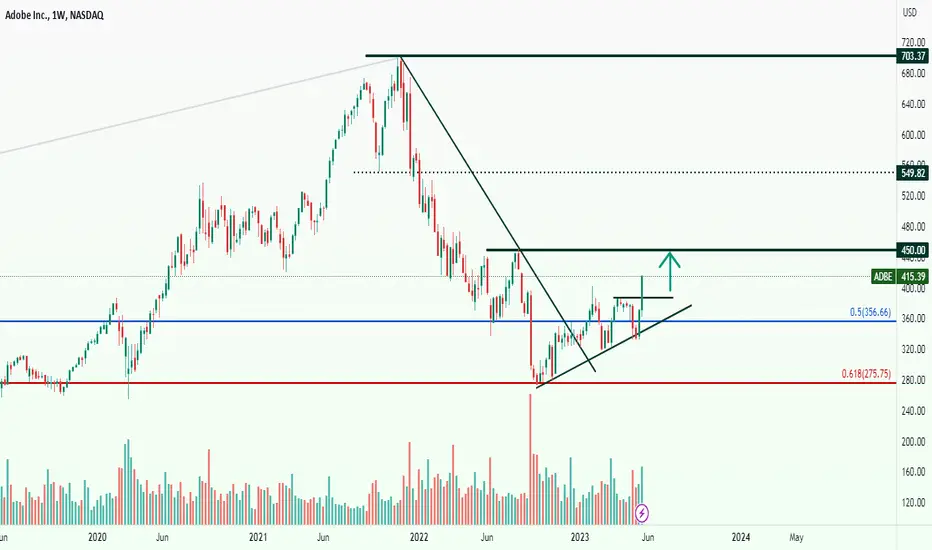
ADBE - Rising Trend Channel [MID -TERM]🔹Breakout rising trend up in the medium long term.
🔹Supports at 450 if NEGATIVE reaction occurs.
🔹RSI bearish diverges against the price, indicating downward reaction.
🔹Technically POSITIVE for the medium long term.
Chart Pattern;
🔹DT - Double Top | BEARISH | 🔴
🔹DB - Double Bottom | BULLISH | 🟢
🔹HNS - Head & Shoulder | BEARISH | 🔴
🔹REC - Rectangle | 🔵
🔹iHNS - inverse head & Shoulder | BULLISH | 🟢
Verify it first and believe later.
WavePoint ❤️

ADBE - Closing GapADBE breaks 350 and 1 candle retest to form new support.
closing the gap. This is a good sign but it may halt futher advancement..
Plan to BoD around 350 if stay above this level or BoB if crosses above the closing gap.
0% Retailer with Storng MCDX banker will make Bull rally

ADOBE: Pull back to the 1D MA50 unless the High breaks.Adobe is consolidating after the June 16th high that was the peak of an enormous 1 month rally. The 1D timeframe has started to normalize (RSI = 68.673, MACD = 19.860, ADX = 22.091) the previously overbought condition but technically there is still some way to go before we reach a low risk buy entry.
We believe that is near the 1D MA50, so we are turning bearish (TP = 450.00). If the 518.55 High breaks however, we will take the loss and go long instead targeting the Resistance (TP = 580.00).
## If you like our free content follow our profile to get more daily ideas. ##
## Comments and likes are greatly appreciated. ##

Bearish Elliot waves This looks like we may be somewhere late in an ABC correction. Attached is a projection of what the following cycle of Elliot waves would be like if this move completed.
We'd be looking for a hard dump sometime soon (Maybe after a spike). Run to the previous low. Chop around there for a little while and then the hard sell-off.

$ADBE tends to be more bullish in July than in JuneFor decades, Adobe has delivered hundreds of intelligent capabilities in its applications through Adobe Sensei, enabling customers to create, work, and collaborate more efficiently.
Adobe Ventures invests in early-to-midstage companies that create software at the forefront of creativity, digital experiences, and document productivity.
TipRanks: Based on the 28 sell-sidetooltipClick this button to read the definition of sell-side analysts who offered a 12-month price target in the last three months.
ADBE - BULLISH SCENARIOWhen considering the purchase of a stock, the future outlook becomes a crucial factor, particularly for investors seeking portfolio growth. While value investors emphasize the importance of intrinsic value relative to price, a compelling investment thesis often revolves around high growth potential at an attractive price. In the case of Adobe, it is projected that the company's earnings will increase by 61% in the coming years, signaling a highly optimistic future. This expected growth is likely to result in stronger cash flows, which in turn should contribute to an increase in the company's share value.
The next price target is $ 520
Risk Disclosure: Trading Foreign Exchange (Forex) and Contracts of Difference (CFD's) carries a high level of risk. By registering and signing up, any client affirms their understanding of their own personal accountability for all transactions performed within their account and recognizes the risks associated with trading on such markets and on such sites. Furthermore, one understands that the company carries zero influence over transactions, markets, and trading signals, therefore, cannot be held liable nor guarantee any profits or losses.

ADBE - Solid Fundamentals and MomentumAdobe Inc. (ADBE) stands out as a company with strong fundamentals. Adobe is renowned for its exceptional products such as Photoshop, Acrobat Reader and Creative Cloud.
ADBE's price climbed up to 54% since May 2023 Rather than succumbing to the fear of missing out (FOMO), a patient approach is warranted. I refused to chase the price. I want the price to come to me.
Waiting for a pullback or the formation of a solid base will provide opportune moments for entry.
A pullback can offer an attractive entry opportunity. Waiting for a pullback or the formation of a solid base would provide me strategic entry points. By monitoring key support levels, daily pivot misses, and structural breakouts as a mean of my timing to buy the stock with optimized risk and reward.
Entry trigger from a pullback : Price retraces to significant levels and then a bullish reversal candle formed or a structural breakout or a daily pivot being missed.
Entry trigger from a solid base : Price breaks the resistance level WITH volume.

$ADBE with a bullish outlook following its earnings #StocksThe PEAD projected a bullish outlook for NASDAQ:ADBE after a positive over reaction following its earnings release placing the stock in drift B with an expected accuracy of 50%.

Adobe's stock will enter a downward trend! Adobe's stock will enter a downward trend!
This chart shows the weekly candle chart of Adobe's stock in the past two years. The graph overlays the recent top to bottom golden section. As shown in the figure, after bottoming out at the end of September 2022, Adobe's stock is now in the fourth largest upward trend band! The long up shadow line at the weekly level last week indicates that in the short term, bulls are weak! In the future, Adobe's stock will enter a downward trend!

Adobe Target $539 - After Consolidation🐂 Trade Idea: Long - ADBE
🔥 Account Risk: 2.50%
📈 Recommended Product: Stock
🔍 Entry: +/- 446.00
🐿 DCA: Yes, down to 400.00
😫 Stop-Loss: 357.00
🎯 Take-Profit #1: 539.00 (50%)
🎯 Take Profit #2: -
🎯 Trail Rest: Yes
🚨🚨🚨 Important: Don’t forget to always wait for strong confirmation once possible entry zone is reached. Trade ideas don’t work all the time no matter how good they look. Do not get a victim of FOMO, there is always another trade idea waiting. 🚨🚨🚨
If you like what you see don’t forget to leave a comment 💬 or smash that like ❤️ button!
—
Adobe participated in the AI boom and made more than 50% from its May low at around 325.00. Huge selling pressure came in around 520.00 showing stronger resistance in that area. We’ll need to see some more consolidation before considering stepping in. First buy zone would be around 446.00 from where one can DCA-in into the stock down to 400.00. We might not see the stock reaching the second buy zone, so consider start buying in multiple tranches starting in buy zone 1.
—
Disclaimer & Disclosures pursuant to §34b WpHG
The trades shown here related to stocks, cryptos, commodities, ETFs and funds are always subject to risks. All texts as well as the notes and information do not constitute investment advice or recommendations. They have been taken from publicly available sources to the best of our knowledge and belief. All information provided (all thoughts, forecasts, comments, hints, advice, stop loss, take profit, etc.) are for educational and private entertainment purposes only.
Nevertheless, no liability can be assumed for the correctness in each individual case. Should visitors to this site adopt the content provided as their own or follow any advice given, they act on their own responsibility.

ADBE Adobe Options Ahead of EarningsAnalyzing the options chain of ADBE Adobe prior to the earnings report this week,
I would consider purchasing the 460usd strike price Calls with
an expiration date of 2023-7-21,
for a premium of approximately $21.60.
If these options prove to be profitable prior to the earnings release, I would sell at least half of them.
Looking forward to read your opinion about it.

Momentum Stock: Adobe IncAdobe has been on a good upward run over the last 9 months recovering a bit over half of its drop from previous highs. I think they are well positioned to take advantage of all the AI momentum and be able to deeply integrate it with their products. Could lead to a significant revival for the brand and its products.
With earnings only 2 days out it is looking a bit expensive on some of the technicals, but I think longer term it could be an interesting stock.
As always how you interpret and decide to act on any results is up to you. This is just data not financial or trading advice and past performance is in no way any guarantee of future performance. Think of it as a way to spot stocks you might be interested in and can add to your watch list and perform further research on and or discuss with your broker.
Again. Not trading advice . Industries and companies change. Trends can end. Do your own research / discuss it with your advisor, but might be one to watch.

ADBE earnings @ 4:05pmAdobe Systems (ADBE) Q4 November 2022 earnings are today 12/15/22 at 4:05pm. ADBE reported Q3 August 2022 earnings of $3.33 per share on revenue of $4.4 billion. The consensus earnings estimate was $3.35 per share on revenue of $4.4 billion. Revenue grew 12.7% on a year-over-year basis. The company said it expects fourth quarter non-GAAP earnings of approximately $3.50 per share on revenue of approximately $4.52 billion. The current consensus earnings estimate is $3.50 per share on revenue of $4.53 billion for the quarter ending November 30, 2022. Here's ADBE levels on the 1-day chart:
Q4 November 2022 Consensus:
EPS: $3.50
Revenue: $4.53 B
SMA10 Triangular Trend Channel:
top = $375
R3 = $365
R2 = $355
R1 = $345
pivot = $335
S1 = $325
S2 = $315
S3 = $305
bottom = $295
SMA's
SMA50 = $318
SMA100 = $345
SMA150 = $361
SMA200 = $378
Do your own due diligence, your risk is 100% your responsibility. This is for educational and entertainment purposes only. You win some or you learn some. Consider being charitable with some of your profit to help humankind. Good luck and happy trading friends...
*3x lucky 7s of trading*
7pt Trading compass:
Price action, entry/exit
Volume average/direction
Trend, patterns, momentum
Newsworthy current events
Revenue
Earnings
Balance sheet
7 Common mistakes:
+5% portfolio trades, capital risk management
Beware of analyst's motives
Emotions & Opinions
FOMO : bad timing, the market is ruthless, be shrewd
Lack of planning & discipline
Forgetting restraint
Obdurate repetitive errors, no adaptation
7 Important tools:
Trading View app!, Brokerage UI
Accurate indicators & settings
Wide screen monitor/s
Trading log (pencil & graph paper)
Big, organized desk
Reading books, playing chess
Sorted watch-list
Checkout my indicators:
Fibonacci VIP - volume
Fibonacci MA7 - price
pi RSI - trend momentum
TTC - trend channel
AlertiT - notification
tickerTracker - MFI Oscillator
www.tradingview.com

Adobe Inc (ADBE), DailyShares in Adobe Inc (symbol ‘ADBE’) have been trading in a relatively sideways movement in the quarter ending May 2023 followed by an aggressive bullish rally in mid May. The company is expected to report its earnings for the fiscal quarter ending May 2023 on Thursday 15th of June after market close. The consensus EPS is $3 compared to the result for the same quarter last year of $2,70.
‘ Adobe enjoys the rare distinction of reporting strong quarterly earnings that either beat or matched estimates consistently for around six years. It is widely expected that the impressive performance seen in the early months of the year will continue in the latest quarter also. ‘ said Antreas Themistokleous, an analyst at Exness
On the technical side the price has been trading in a rather aggressive bullish movement in the last month after hype around AI related products and the companies offering them, Adobe included. The price found resistance around the round number of $440 which is also an inside resistance area since mid August 2022 and is currently correcting to the downside at the time of this report.
Even though the 50 day moving average is still above the 1oo day moving average indicating that the overall bullish momentum is still valid, the Stochastic oscillator is in the extreme overbought level for the past two weeks possibly signaling that a correction to the downside might continue until it declines back into the “neutral levels''. Bollinger bands have massively expanded signaling that the volatility in the market for the company share is still fueled up so it is not surprising to see another major move in either side in the coming sessions.

ADBE - BULLISH SCENARIOAdobe Inc. (ADBE) is experiencing a positive surge in its stock price, with an increase of 4.54%. Adobe's price-to-earnings ratio is 46.77, while its dividend yield is currently not available. The company's market capitalization is valued at $208.25 billion, with a stock range of $459.42 to $478.04.
The rise in Adobe stock can be attributed to favorable comments from financial analysts regarding the company's financial performance and its new strategy focusing on generative artificial intelligence. Adobe is set to release its fiscal second-quarter earnings report after the market closes on Thursday.
Last week, Adobe announced its plans to introduce a paid version of its Firefly suite, a set of generative AI tools targeting commercial customers. This announcement has contributed to an 11% increase in Adobe's stock since then.
Analysts believe that while Adobe may surpass earnings estimates for the quarter, the company's emphasis lies in its generative AI strategy and its proposed $20 billion acquisition bid for Figma, a provider of collaborative design tools. Regulatory reviews for the deal are currently underway in the United States and the United Kingdom, with decisions expected to be announced later this month.
In recent months, Adobe has been making significant strides in expanding its portfolio of generative AI software. Previously, Adobe offered its new tools for free on the Firefly website, allowing users to experiment with photo-editing tools and a service that can generate images based on simple text commands, similar to OpenAI's Dall-e app. However, Adobe clarified last week that Firefly is more than just a collection of digital experiments – it believes that generative AI will drive its growth rate going forward.
Risk Disclosure: Trading Foreign Exchange (Forex) and Contracts of Difference (CFD's) carries a high level of risk. By registering and signing up, any client affirms their understanding of their own personal accountability for all transactions performed within their account and recognizes the risks associated with trading on such markets and on such sites. Furthermore, one understands that the company carries zero influence over transactions, markets, and trading signals, therefore, cannot be held liable nor guarantee any profits or losses.
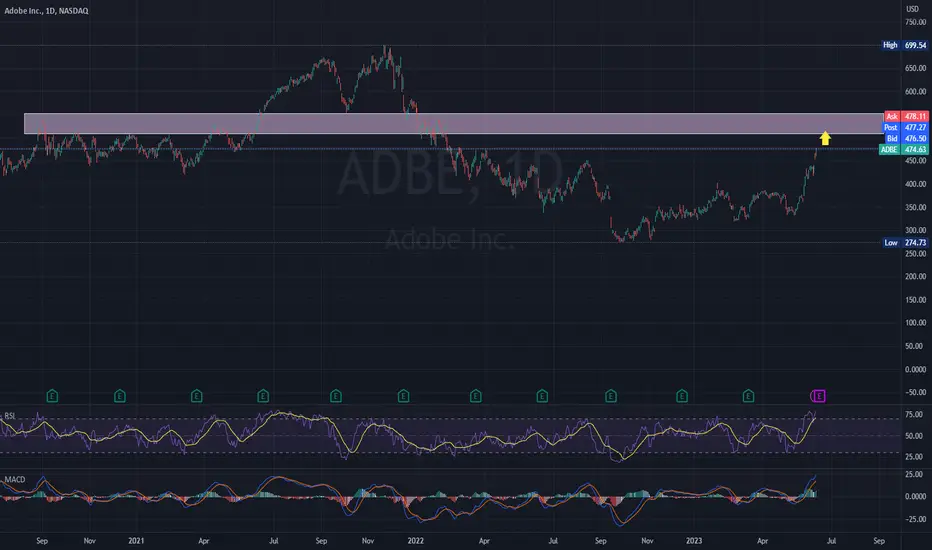
$ADBE Fibonacci 618 resistance NASDAQ:ADBE resistance is at the horizontal line and its a 618 Fibonacci resistance level

Adobe key positioning for the future of A.I made graphics.TA: Looking at interest levels and daily RSI, taking a long here is sub-optimal and has risk of drawdown. However, fundamentals back upwards momentum. Buy and Hold strategy here might be wise. Pivot line may yield a double top (A.I boom -> Burst) or could initiate further upwards momentum to new ATH's in which case TP2 and TP3 are the interest levels.
Fundamentals:
Adobe is a global leader in software, known for its Creative Cloud suite, which includes industry-standard applications like Photoshop, Illustrator, and Premiere Pro. The company has made significant strides in integrating advanced AI technologies into its products and services, which has contributed to its impressive financial performance.
A significant recent innovation is the integration of Generative AI and Adobe Firefly into Photoshop, marking a new chapter in Adobe's history. This innovation allows creators to use their natural language to prompt Photoshop to create extraordinary images with Generative Fill, a feature powered by Adobe's Firefly, a family of creative generative AI models2.
Adobe is also committed to ensuring its AI technology is developed ethically, focusing on accountability, responsibility, and transparency. They are developing a compensation model for Adobe Stock contributors and are taking steps to prevent artists’ names from being used in Adobe’s generative AI actions2.
In terms of their competitive advantage, Adobe's significant graphics dataset is instrumental. Adobe Stock, for instance, has a landmark dataset containing more than two million assets. Adobe has leveraged this immense dataset to train its AI technology, Adobe Sensei, to effectively detect landmarks in images submitted to Adobe Stock. This capability has been crucial for identifying and categorizing images and addressing any potential intellectual property issues with them3.
The integration of AI in Adobe Photoshop is demonstrated by the Generative Fill feature, which is powered by Adobe Firefly. Firefly is a family of creative generative AI models that are infused into every selection feature in Photoshop, and allows users to add content, remove or replace parts of an image and extend the edges of an image using natural language prompts. Adobe Firefly, which launched six weeks prior to the announcement I found, had quickly become one of the most successful beta launches in Adobe's history, with beta users generating over 100 million assets to date1.
For Adobe Stock, the company uses Adobe Sensei, their artificial intelligence and machine learning technology, to detect landmarks in the hundreds of thousands of images submitted by Stock contributors every week. This helps in categorizing images and identifying any potential intellectual property issues. Adobe's landmark dataset contains more than two million assets and the process of training the model to detect landmarks initially took around 7-8 days on a single-GPU machine. By switching to a multi-GPU machine and employing parallel computing, they managed to reduce the training time by 80%, bringing it down to 1-2 days without any impact on model accuracy2.
Adobe has further enhanced the value of its graphics dataset by adopting advanced machine learning techniques. To improve the efficiency of their AI training processes, they've transitioned from a single-GPU machine to a parallel computing approach with multi-GPU machines, resulting in a dramatic 80% reduction in training time without sacrificing model accuracy3.
Adobe's significant graphics dataset and its innovative application of AI technologies, as demonstrated in the integration of Generative AI and Adobe Firefly into Photoshop, contribute to its competitive advantage in the industry.
Please note that this is a preliminary research paper and you should continue to do your own research (DYOR). Information about assets can change rapidly, and it's essential to stay updated with the most recent developments.
Notes on how I personally use my charts/NFA:
Each level L1-L3 and TP1-TP3 (Or S1-S3) has a deployment percentage. The idea is to flag these levels so I can buy 11% at L1 , 28% at L2 and if L3 deploy 61% of assigned dry powder. The same in reverse goes for TP. TP1: 61%, TP2:28% and TP3:11%. If chart pivots between TP's, in-between or in Between Sell levels these percentages are still respected. I like to use the trading range to accumulate by using this tactic.
Just my personal way of using this. This is not intended or made to constitute any financial advice.
This is not intended or made to constitute any financial advice.
FED Macro Situation Consideration:
All TP's are drawn within the context of a return to FED neutral policy. I do not expect these levels to be reached before tightening is over.
NOT INVESTMENT ADVICE
I am not a financial advisor.
The Content in this TradingView Idea is for informational purposes only, you should not construe any such information or other material as legal, tax, investment, financial, or other advice. Nothing contained within this idea constitutes a solicitation, recommendation, endorsement, or offer to buy or sell any securities or other financial instruments in this or in in any other jurisdiction in which such solicitation or offer would be unlawful under the securities laws of such jurisdiction.
All Content on this idea post is information of a general nature and does not address the circumstances of any particular individual or entity. Nothing in the idea/post constitutes professional and/or financial advice, nor does any information on the idea/post constitute a comprehensive or complete statement of the matters discussed or the law relating thereto. You alone assume the sole responsibility of evaluating the merits and risks associated with the use of any information or other Content on the idea/post before making any decisions based on such information.

Adobe ,,, weekly viewUptrend
Totally, It has entered to an uptrend and I'm waiting to touch 450 and then 700 in mid and long term.