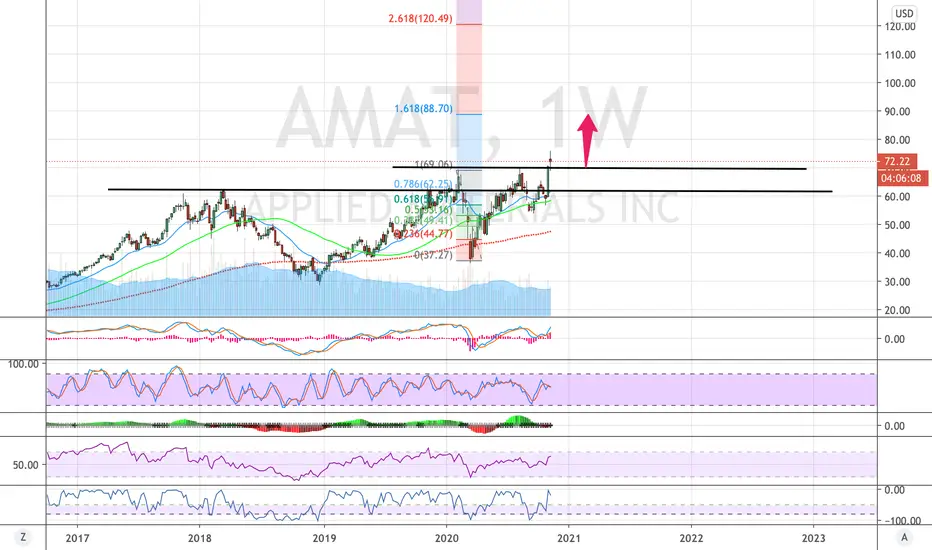
Amat catch-up to previous trend.Applied materials is a provider of equipment and services to chip maker’s. Chip are in high demand.
Applied had good earning that will likely generate upgrades.
$100 by eoy IMO
1AMAT trade ideas

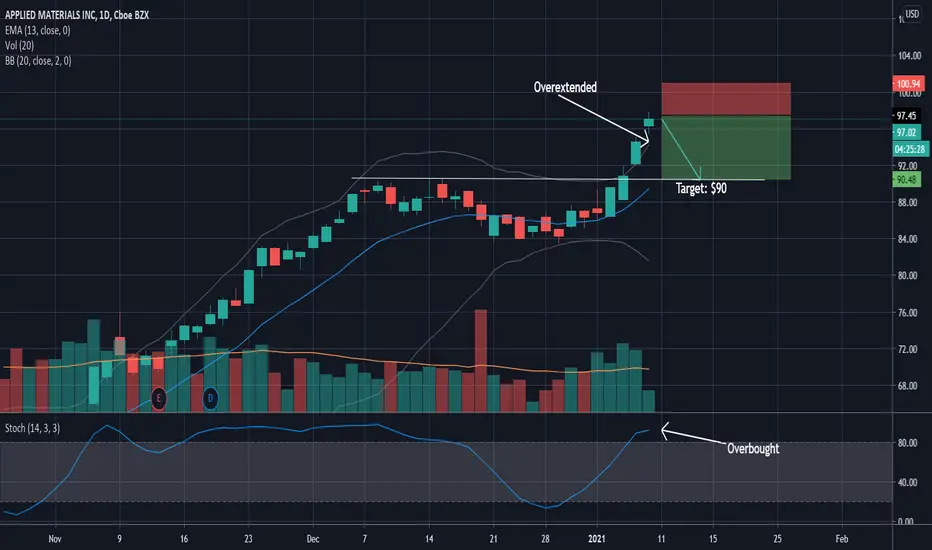
AMAT SnapbackAMAT is on its fourth consecutive green day, pushing over the upper bollinger band and becoming over bought being above 90 on stochastics. I 'm expecting a pullback back to the original breakout level at the 90 range.
It's just a matter of time - AMAT for a long playApplied materials belongs to the technology industry, is engaged in the manufacture and marketing of systems and equipment for testing and processing for the semiconductor industry. Looks good for or further upward movement , in the last two months showed strong movement and rose about 50% and also recently received an upgrade, presented a strong financial report in the fourth quarter with revenues rising by 25.1% to 4.69 billion and expecting continued growth for 2021.
Technically,
⚡️ The RSI isn’t in over-buying area, which indicates a place for upward movement,
⚡️ moving averages support the said direction - now trades above the moving average 20.
⚡️ As for bollinger bands - it trades in the baseline area so that there is room for upward movement.
⚡️ Attention: MACD is still bearish and presents an uncertain picture - this should be taken into account..
It may continue to trade in the range of 83-88 before breaking the aforementioned level, trading entry of trades should be monitored alongside a windfall from the market.
Earnings: on February 18
All of the above at your discretion, trading rules accepted by you, trading strategies and transaction management under your preferences.


AMAT call buy 90 July 16 2021 cmp:88.05 sl:88 4 Dec premium: 9AMAT call buy 90 July 16 2021
cmp:88.05 sl:88 4 Dec premium: 960

Applied Materials: time go to short AMAT oversold to other semiconductors, time to go short or wait for good entrance

Sell Signal: 77.39Ingenuity Trading Model-
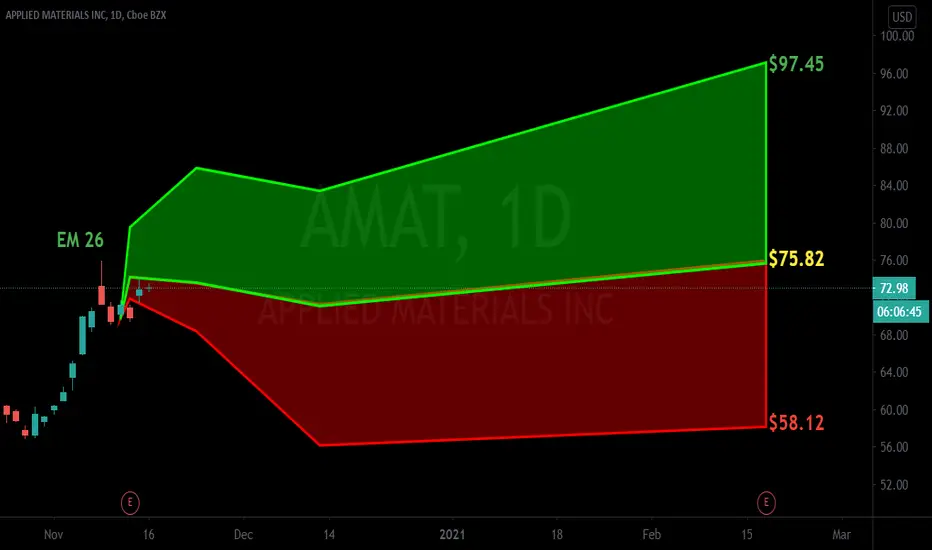
Geometric Markov Model : In probability theory, a Markov model is a stochastic model used to predict randomly changing systems. Markov Models are used in all aspects of life from Google search to daily weather forecast. The randomly changing systems we focus on are the equity, futures, and forex markets. The geometric element of the model is the fractal wave structure you can find on any chart you look at across any market and across all time dimensions.
Our model focuses on the current wave formation (current state)- geometric price formation along with its volume and volatility over a given time period and using that information to predict the future state- future price movement.


$AMAT with a projected neutral outlook after earningsWith a Positive under reaction following its earnings, $AMAT it projected to have a neutral outlook with the PEAD placing the stock in Drift A.
If you would like to see the Drift for another stock please message us. Also click on the Like Button if this was useful and follow us or join us.

Symmetrical TriangleSymmetrical Triangle can go either way
Looks like this one chose up
Triangles can be best described as horizontal trading patterns. At the start of its formation, the triangle is at its widest point. As the market continues to trade in a sideways pattern, the range of trading narrows and the point of the triangle is formed. In its simplest form, the triangle shows losing interest in an issue, both from the buy-side as well as the sell-side: the supply line diminishes to meet the demand.
Just an observation
Happy Trading


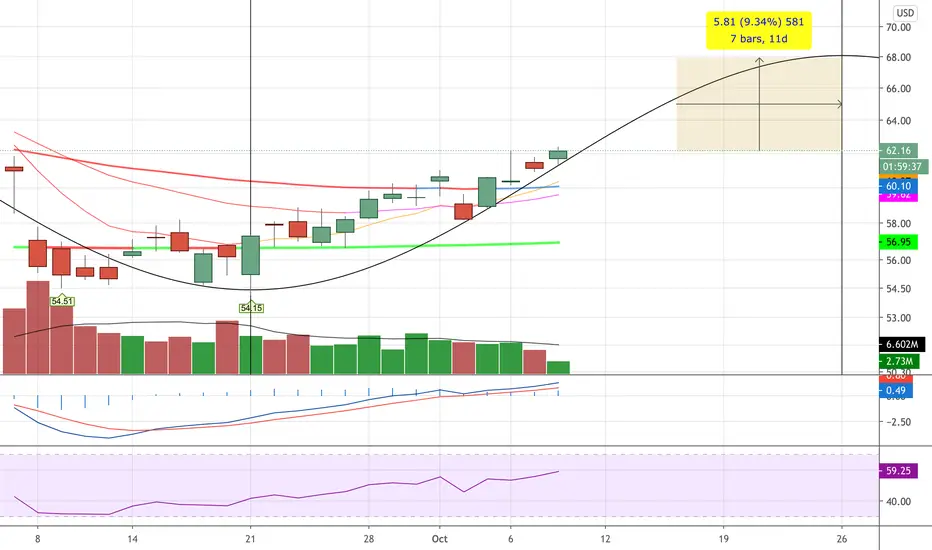
AMAT on watchSuper nice close on the day. It has tested this level a few time and been rejected hard so it needs a clean
break on volume. Itwill probably need a pull back and few runs to get through. If it does break the high it has good upside potential.

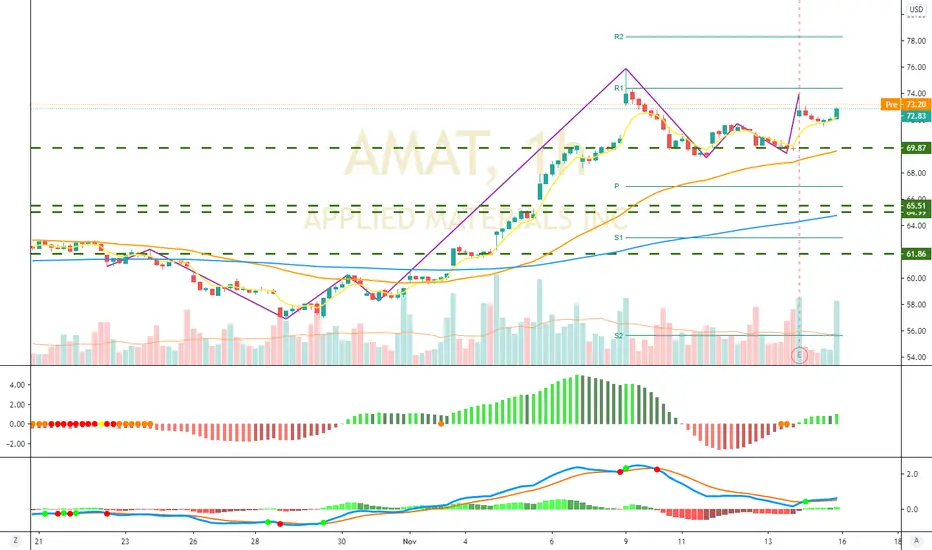
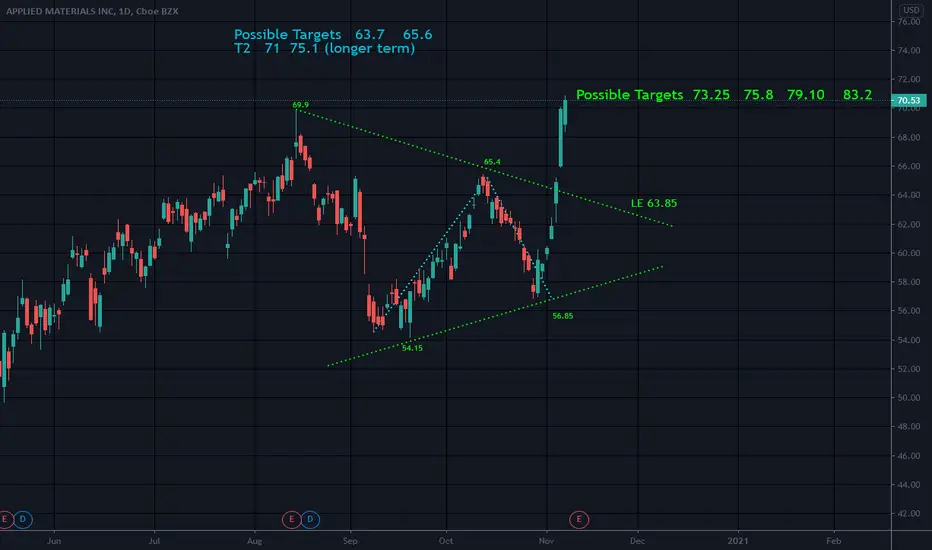
AMAT Long Breakout IdeaAMAT is attempting to break above 70 for the 3rd time. Looking for a 5 point move to 75. Stop below 69.


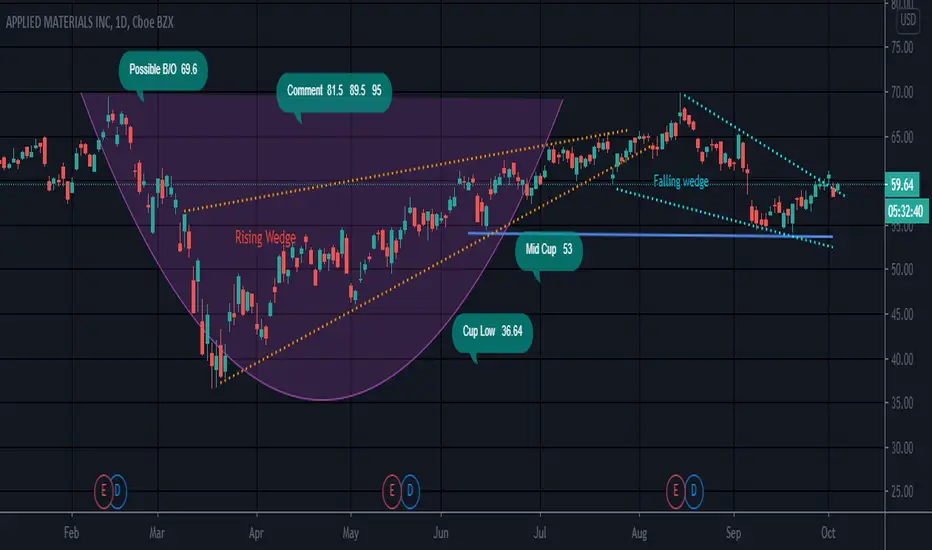
Cup and Handle Falling WedgeHandle low cam very close to mid cup which is 53.04. Amat has fallen from a bearish Rising wedge
Had it went under mid cup the pattern is invalidated
AMD also came very close to mid cup a little while ago before it broke out.
AMAT is in a falling wedge pattern as well
The falling wedge can be a reversal pattern, but it can also fit into the continuation category. As a continuation pattern, the falling wedge will still slope down, but the slope will be against the prevailing uptrend. As a reversal pattern, the falling wedge slopes down and with the prevailing trend. Regardless of the type (reversal or continuation), falling wedges are regarded as bullish patterns. This is sloping down with the prevailing trend. Amat has been in the falling wedge for over 3 weeks which is also a requirement to become a FW , and not a bear flag
If it breaks up and out of the FW , then perhaps it will reach its targets
Be safe
Not a recommendation
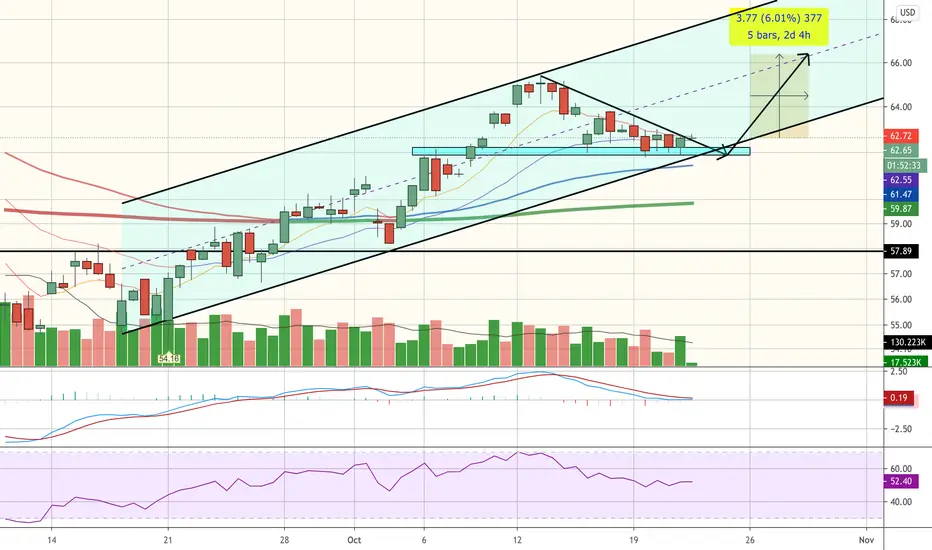
Watch that bottom lineMy favorite of the "classics" as I'd like to call it. Put that top line wherever you want, but its the bottom line that matters.

AMATAMAT nearest support at 54.20 and Resistance at 56.37 & 58.02.
From wave perception, AMAT might wnna make diagnol and if that happen, short till price 39.46. TAYOR
