AMAT bullish along with SMH. $230 for AMAT. $250 for SMHAMAT is a big one on the SMH etf, so I got one for more exposure. Let's get it. I'm in for $230 approx TP.
NFA - IDEAS ONLY. Plus its always better to have it in writing.
Opinion always
1AMAT trade ideas

AMAT Applied Materials Options Ahead of EarningsAnalyzing the options chain and the chart patterns of AMAT Applied Materials prior to the earnings report this week,
I would consider purchasing the 210usd strike price Puts with
an expiration date of 2024-9-20,
for a premium of approximately $16.95.
If these options prove to be profitable prior to the earnings release, I would sell at least half of them.

WILL AMAT CONTINUE ITS MARK UP?Trading range formed, im bias to Re-Accumulation
And, price contracting, seems supply drying up
Entry as attached
Pure Wyckoff

AMAT - BullishAMAT is ready to launch and move up to 226. My entry is here after it just broke the 213 resistance.
Good luck
Not financial advice

$AMAT: WORTH TO TAKE IT?AMAT can be interesting here, as well, only for those who wants to play a bit.
On the 4H: MM50 touched soon
On the D: MM20 touched
I would be shocked if we bounce a bit but could potentially continue to go down to touch the MM50 D in case of a bad macro

Waiting for these buy-zonesHoping to get a shot on these buy-zones.
Around 140 is my first fib retracement zone and will be my first entry when it gets there.
When it hits the second fib retracement zone at around 120 I will buy some more.
Will be a longterm hold, just want to get it at a good price.

Applied Materials Surges on Upbeat AI-Boosted ForecastApplied Materials Inc. (NASDAQ: NASDAQ:AMAT ) is emerging as a frontrunner, riding high on a wave of optimism following its recent forecast announcement. The company's shares surged an impressive 13% in premarket trading on Friday, fueled by a promising outlook fueled by robust demand for AI-enabled chips.
Analyzing the Surge:
The semiconductor equipment supplier's bullish forecast for the second quarter, coupled with a strong performance in the first quarter, has ignited investor enthusiasm. Analysts and investors alike are startled by the company's well-diversified portfolio, which positions it for further gains amidst a backdrop of multiple technology inflections.
AI-Enabled Chips Driving Growth:
Applied Materials' ( NASDAQ:AMAT ) upbeat outlook is largely attributed to the surge in demand from customers seeking to capitalize on AI technology. As industries increasingly pivot towards artificial intelligence for enhanced efficiency and productivity, the need for specialized chips tailored for AI applications has skyrocketed. Applied Materials ( NASDAQ:AMAT ) finds itself in the conduit of this burgeoning market, poised to capitalize on the lucrative opportunities presented by AI-driven innovations.
Diversification and Technological Inflections:
Analysts at J.P. Morgan underscore Applied Materials' ( NASDAQ:AMAT ) strategic positioning to benefit from multiple upcoming technology inflections. With a diverse portfolio catering to various electronics end-markets, including smartphones and personal computers, the company is well-positioned to outperform its peers in the wafer fab equipment (WFE) sector over the coming years.
Strong Financial Performance:
Applied Materials' ( NASDAQ:AMAT ) stellar financial performance further reinforces investor confidence. The company's forecast for second-quarter revenue, ranging from $6.5 billion to $6.9 billion, surpassed market expectations. Additionally, adjusted profit per share is anticipated to range from $1.79 to $2.15, indicative of robust earnings growth.
Expanding Market Opportunities:
One particularly promising area highlighted by analysts is the exponential growth expected in high-bandwidth memory (HBM) packaging revenues. Applied Materials ( NASDAQ:AMAT ) anticipates HBM packaging revenues to quadruple compared to the previous year, underscoring the burgeoning demand for specialized memory solutions tailored for high-performance computing applications.
Analyst Sentiment and Investor Response:
The overwhelmingly positive response from analysts is reflected in the flurry of rating upgrades and upward revisions in price targets. At least four analysts have raised their ratings, with eight adjusting their price targets upwards, according to LSEG data. The company's stock, currently valued at 22.77 times its one-year forward earnings, presents an attractive investment opportunity compared to the industry average.
Conclusion:
Applied Materials' ( NASDAQ:AMAT ) bullish forecast and promising outlook underscore its position as a key player in the semiconductor industry. With a strategic focus on AI-enabled chips, diversified portfolio, and strong financial performance, the company is primed for sustained growth in the dynamic landscape of semiconductor technology. As investors eagerly await further developments, Applied Materials ( NASDAQ:AMAT ) stands poised to capitalize on the transformative potential of AI-driven innovations, driving value for shareholders and stakeholders alike.

AMAT rocketed out of earnings Short then LongAMAT on the 15 minute chart jumped 13 % from earnings and is now in the $212 range. The 0.5
fib level is 202.65. I have 3 call options striking $190 for July purchased only a day ago.
Trade plan. I will sell two calls and collect profit. I am buying a put option striking $204
expiring on 2/23/24 expecting a fall to the retracement line. I will close the put option
when price gets under $204, Porfits will be used to buy another AMAT call option for July
this time for a strike of $210 to lower cost.

AMAT Ascending channel breakoutReasons for bullish bias:
- Price moving in ascending channel
- Entry is at 0.382 fib retracement
- Safe entry will be above 179.35(HH breakout)
- TP till projection
Entry Level(buy limit): 167.47
Stop Loss Level: 146.92
Take Profit Level 1: 188.02
Take Profit Level 2: 200.57

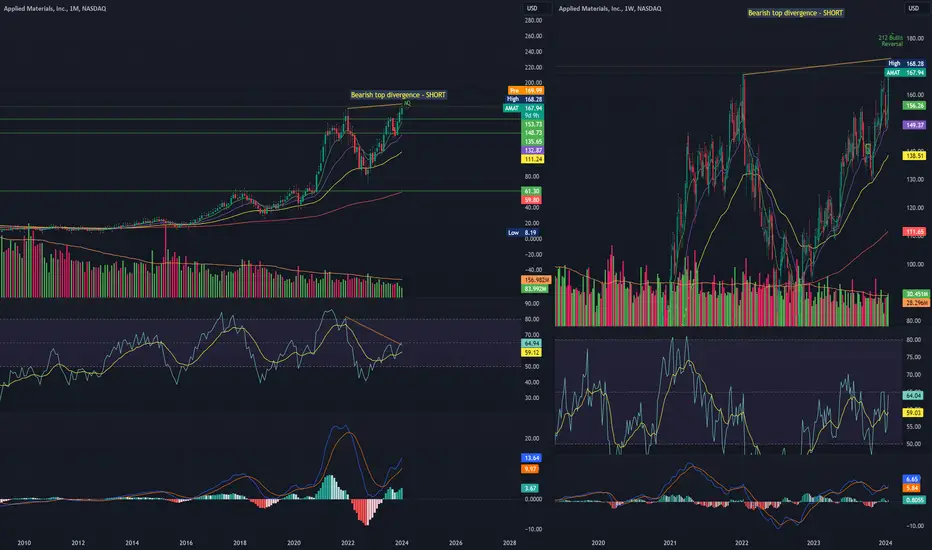
$AMAT Bull trap takes days to realise.NASDAQ:AMAT alerted a few days ago based on monthly time frame Vs RSI peaks divergence. Now coming through. Things are fluid so keep an eye.😁👍 Happy trading.

$AMAT bearish divergence NASDAQ:AMAT has a good run and looking extended with RSI and price showing divergent pattern. Bearish! SHORT!
price breakout at 153currently weve got significant bullish momentum within the electronic technology stock sectors and as such APPLIED MATERIALS should continue to benefit from the current upside this sector is receiving. Current price action is on its way to 170-175 and most likely will break those ranges based on current buying momentum that it received within the low 160 range. Price is above the ichimoku cloud with a green bullish candle currently ending the week, and as we look to the left weve got consecutive buying volume as shown to the bottom left in green. The price is over the 30 day moving average and has cleared the 9 day moving average signalling further bullish sentiment, the macd and signal line are progressingly leading to the upside. The next price resistance would be around 168.16 which it failed to do so on jan 02 2024, even with the bullish flat pattern forming on the four hour as shown to the left starting around the low 140s.

AMATApplied Materials is the global leader in nano manufacturing technology solutions with a broad portfolio of innovative equipment, service and software products for the fabrication of semiconductor chips, flat panel displays, solar photovoltaic cells, flexible electronics and energy efficient glass.
Strength below range highs.

AMAT short positionHi traders,
let's take a look at AMAT chart.
On chart are shown resistance and support lines.
If the prices reaches the resistance line, you can take short position.
Entry price, target and the stop loss are shown on the chart.

AMAT - 5 months HEAD & SHOULDERS══════════════════════════════
Since 2014, my markets approach is to spot
trading opportunities based solely on the
development of
CLASSICAL CHART PATTERNS
🤝Let’s learn and grow together 🤝
══════════════════════════════
Hello Traders ✌
After a careful consideration I came to the conclusion that:
- it is crucial to be quick in alerting you with all the opportunities I spot and often I don't post a good pattern because I don't have the opportunity to write down a proper didactical comment;
- since my parameters to identify a Classical Pattern and its scenario are very well defined, many of my comments were and would be redundant;
- the information that I think is important is very simple and can easily be understood just by looking at charts;
For these reasons and hoping to give you a better help, I decided to write comments only when something very specific or interesting shows up, otherwise all the information is shown on the chart.
Thank you all for your support
🔎🔎🔎 ALWAYS REMEMBER
"A pattern IS NOT a Pattern until the breakout is completed. Before that moment it is just a bunch of colorful candlesticks on a chart of your watchlist"
═════════════════════════════
⚠ DISCLAIMER ⚠
The content is The Art Of Charting's personal opinion and it is posted purely for educational purpose and therefore it must not be taken as a direct or indirect investing recommendations or advices. Any action taken upon these information is at your own risk.

Possible Iv H&S on AMATThere is an In H&S possibly forming on AMAT. The target is around the .786 fib retracement to ATH.

AMAT BottomingNothing special here but AMAT is struggling the fifth day with the current level.
Of course this may be a consolidation level. Therefore a bet on an upward correction must be combined with a tight stop.

Support HeldThe end September low has just held. Due to the steep decline last days I can imagine an attempt to test the highs of past week again.

AMAT Potential Selling OpportunityThe U.S. Department of Commerce announced Tuesday that it plans to prevent the sale of more advanced artificial intelligence chips to China in the coming weeks. The U.S. government says the new rules are intended to close loopholes that popped up after last year's restrictions on AI chip exports went into effect.
If the U.S. restricts or closes the leeway that allows Chinese companies to access American AI chips, it can disrupt the global semiconductor supply chain. Applied Materials is a key player in providing equipment and technology for semiconductor manufacturing.
A disruption in the supply chain or reduced demand from Chinese customers could negatively impact their revenue and stock price.
Cycle Sniper is about to send the sell signal on the weekly chart.
After a potential breakdown of the ascending trendline and closing below 130 $ , stock price may go to 122 $ and 110 $
Good Luck

$Amat met all the criteria to keep going up✅Created demand zone below
✅Retested that zone
✅Crossed above the resistance
I am bullish on this. Target is 155.46 and stop loss closing below 141.20

The goal of reducing 60$According to the Butterfly pattern, the Fibo perfectly converges the decline to the target of $ 60. We also go down the channel where the lower border of the channel will be. All 3 parameters should be added together. We should reach it by May 2024, there will be a great point for going to long.

AMAT Applied Materials Options Ahead of EarningsAnalyzing the options chain and the chart patterns of AMAT Applied Materials prior to the earnings report this week,
I would consider purchasing the 130usd strike price Puts with
an expiration date of 2023-11-17,
for a premium of approximately $6.30.
If these options prove to be profitable prior to the earnings release, I would sell at least half of them.
Looking forward to read your opinion about it.

$AMAT - Are we there yet?NASDAQ:AMAT - A great company with a great future.
The weekly chart suggest a measured move at play to $167.xx and change.
The move coincides with a Double Top as well. So a question remains - are we there yet? Well time will tell!
