$AMC - AMC Entertainment Holdings - BuyTrading within the upper range of the demand zone. I'll be always buying above 12.16 and sell below. The moon could be around 145 for me.
1AMC trade ideas

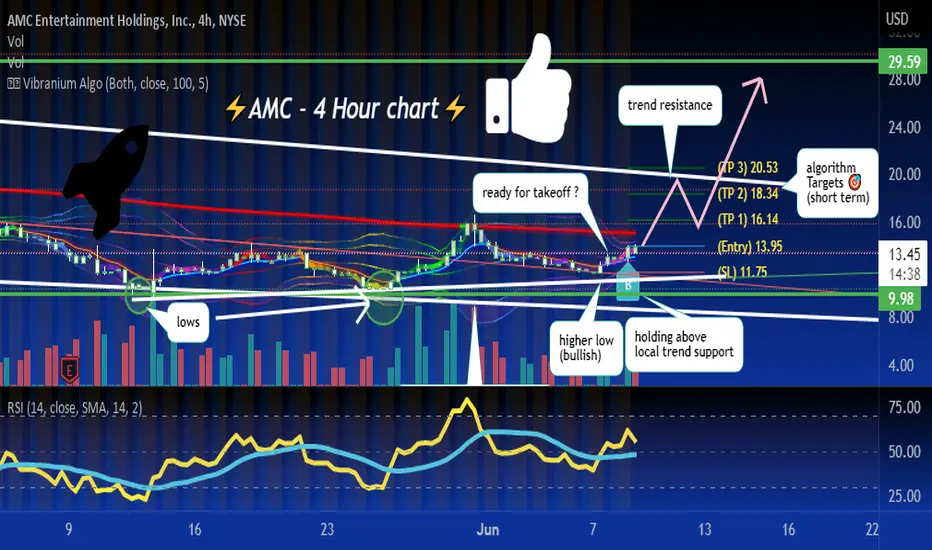
bullish higher low structure, apes are strong 🐒higher lows, increase in buyer volume on meme stocks, bullish algo targets, bouncing off extreme support zone from bigger timeframe.
Targets are 16.14-18.34-20.53
so many reasons to be a AMC bull now, is it finally time for another short squeeze?☃
$AMC: 30$ Incoming?⚡Bottomed out on monthly Ichimoku Cloud
⚡Bullish Divergence on the MFI
⚡Bottoming signals on the Vix Fix Indicator
⚡TD-Sequential red 9 (Indicates bottom, more accurate on larger time frames)
⚡AMC needs to reclaim the monthly VWAP above 13$
⚡Break the 14-16$ Resistance
⚡Break above 18.75$ (Monthly Ichimoku Cloud resistance) for larger moves
⚡Bullish Options Chain, hints for upside
⚡Break and hold above 14$ = Bull
⚡Reject the 14$ level = Bear
*WARNING* This thread is not financial advice. I am not a financial advisor.

Analysis-uptrendGood morning all. As you see on the chart we will have a big probability of an uptrend.Thanks.

AMC Time Horizon & Price Targets Sometimes current events seam like an organic component of the extension of the pattern. Short selling and hedge funds may be playing their games but it looks like their window of opportunity is limited.. Lets hope the pattern plays out. Let me know what you think in the comments below.
This is not investment advice, but only my perspective..

AMC fractal cycle (5 parts)Most of us who looked into the executive order catalyst will understand why we saw the push down after june 3rd, and more-so why we are where we are today. Here, I show my idea for the fractal cycle. Before a cycle begins, there is usually a selloff, however, that can be debated as the full year leading up to the jan squeeze can be technically defined as a 'sudden spawned start', if you get what I'm saying (though there is an entry by sell off). If you look at the 1hr chart, and go back to 2020, you can find small renditions of the pattern we see if we zoom out (say on the weekly). I will post a link to that example.
So, my idea is that when executive order 14032 got signed on June 3rd, 2021, the cycle was halted, and purple was put on hold. Now, we have been traversing green. The cycle is not complete until purple is finished and white enters play. It goes:
1) red - accumulation
2) yellow - accumulation
3) green - accumulation
4) purple - distribution
5) white - sell off
restart.
In essence, it is very simple to know when a new cycle begins. As soon as the high of one section is surpassed, the new cycle begins. So for 2020, the high was 7.56. As soon as we ran past that, macro yellow 2021 began. The high for yellow 2021 was 20.36 (not including ah/pm). As soon as we ran past that.. you get the point. So purple will start as soon as we run past 72.62. So a question that should concern you is, 'well it could hit 73 and just sell off?' Yes, that is logically valid. It is up to you how you traverse that new cycle. Look at my plot maps (only 2) and see how you might consider purple representing higher than just 73. But of course.. this is not financial advice.
So things to look for for 2nd & 3rd week of june:
need a triple bottom around 9.70 (if it breaks 9.70 then we are still in a sell off period - short term)
If we get the triple bottom then it would signal a buy.
August 2nd is next catalyst with regards to executive order. The real question is (addressing any firms tied up in this) to be or not to be first. God speed

If the $AMC shorts win, here's what it COULD look likeWith the prospect of war, rising gas prices, political division, rising interest rates, rumors of a real estate supply collapse, and seemingly one crisis after another, the markets have been hit hard, with all of the euphoria from the previous year which say +1000% gains in numerous stocks and cryptos, it only makes sense that shorts sellers would pile on to certain tickers.
It's been a tough year already for many investors and capitulation and market sentiment seems to be shifting ever bearish. The real question though is, How long can this bear market continue?
For answers we can look to past bear markets for insights. The worst bear markets in history were roughly in sync with recessions. The stock market crash of 1929 was the central event in a grinding bear market that sliced 89% off the value of the Dow Jones Industrial Average over approximately three years.
Between April 1947 and April 2022, there have been 14 bear markets, ranging in length from one month to 1.7 years, and in severity from a 51.9% drop in the S&P 500 to a decline of 20.6%
The bear market from 2007 to 2009 lasted 1.3 years and sent the S&P 500 down by 51.9%.5 The U.S. economy had slipped into a recession in 2007, accompanied by a growing crisis in subprime mortgages, with increasing numbers of borrowers unable to meet their obligations as scheduled. This eventually snowballed into a general financial crisis by September 2008.
So what can we expect from the market this time? It's hard to predict the outcome of any particular event when so many variables can affect t the outcome, especially over lengthy timespans.
As much as I would hate to see it, the above graphic depicts what a rejection and contuation of bearish sentiment could look like in AMC until late 2024 early 2025, when hopefully we get a president the public can generally agree upon and get behind. How I long for the glory days when investor sentiment was high and days were green more often than not.
Personally, I see it as a really great buying opportunity and if it does continue, I guess the silver lining would be that I was able to take that time and scoop up a shitload of discounted shares from numerous companies.
Only time will tell however. Good luck to all!


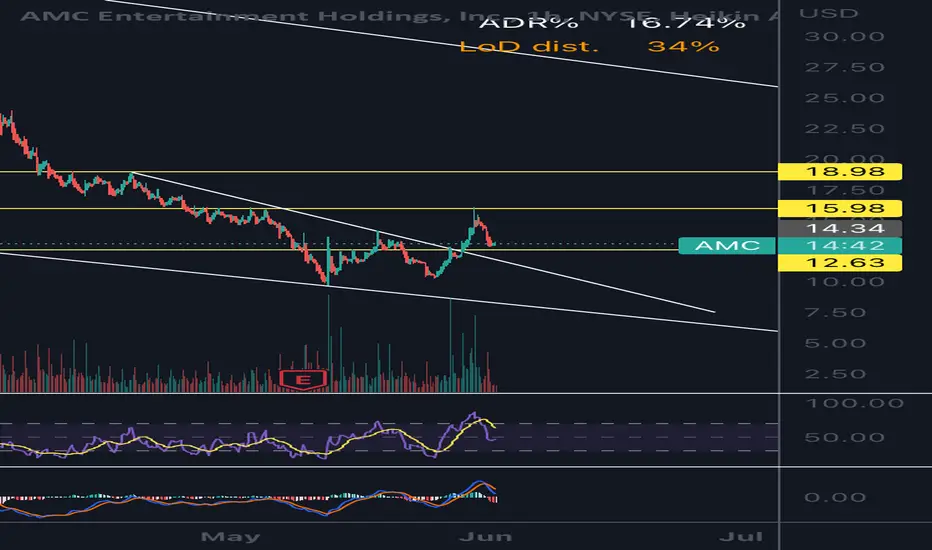
Amc Looks be backtesting a w pattern neckline. This would be the confirmation a trader would need to place a long postion. If we control from 12.63-13$ as support this could be the launching pad to retest 16$ reistance and ultimately break through to test the 19$ range. If we lost 12.63 , 11.88 $ is another key support to watch but I am inclined to see the 12.63 hold
AMC Long Ok. I'm sorry for jumping in the hype of marking up AMC. It was too good not to pass up. We all know that AMC has been crashing for some time now. Is there really light at the end of the tunnel? I think it but not the light we seen before. Price still needs to break out its current state and show me its ready to go back in the bull territory. Until then I did place some buy points for me. I get it you want to sell high and buy low. With the risk of AMC I want to be 80% sure we are heading in the right direction.

📊 the big squeeze is coming, can you smell it? 🤝AMC bouncing from extreme support zone/cluster support!
once we clear the local trend resistance I expect a nice rally to 29.59-45.54-56.11

Summary on AMCOn AMC we see on the chart different element that show us that we are in a downtrend.Thanks.

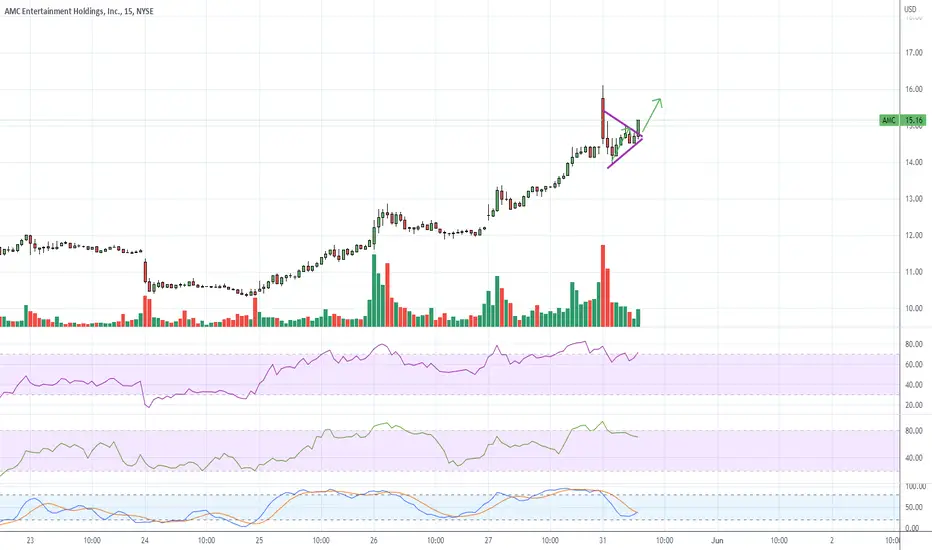
AMC chart for day tradersLooks like AMC broke upwards out of a pennant if you're inclined to day trade....
AMC bullish breakout
breaking out from major support area
1st PT around 50dma and 2nd PT around 200dma
stop if closes under 10dma for a couple of days

AMC: Top Gun 2 will boost stock!AMC
Intraday - We look to Buy a break of 14.80 (stop at 9.61)
Posted a Double Bottom formation. This is positive for sentiment and the uptrend has potential to return. A break of 14.50 is needed to confirm follow through bullish momentum. Further upside is expected.
Our profit targets will be 29.37 and 34.30
Resistance: 14.50 / 20.00 / 30.00
Support: 10.00 / 7.50 / 2.20
Please be advised that the information presented on TradingView is provided to Vantage (‘Vantage Global Limited’, ‘we’) by a third-party provider (‘Signal Centre’) . Please be reminded that you are solely responsible for the trading decisions on your account. There is a very high degree of risk involved in trading. Any information and/or content is intended entirely for research, educational and informational purposes only and does not constitute investment or consultation advice or investment strategy. The information is not tailored to the investment needs of any specific person and therefore does not involve a consideration of any of the investment objectives, financial situation or needs of any viewer that may receive it. Kindly also note that past performance is not a reliable indicator of future results. Actual results may differ materially from those anticipated in forward-looking or past performance statements. We assume no liability as to the accuracy or completeness of any of the information and/or content provided herein and the Company cannot be held responsible for any omission, mistake nor for any loss or damage including without limitation to any loss of profit which may arise from reliance on any information supplied by Signal Centre.

AMC Will pounce when the time is right
Strong OBV despite ugly price action
Strong support around 12


AMC Price Prediction for First Week of June 2022This chart is the run-up of May/June last year (2021) with my prediction of how this coming week will play-out if the past repeats. Dates in RED are current dates (this year) with the correlating price it was during last year's run.

[STOCKS] AMC Position Management (DCA)Hello everyone,
I've been covering the AMC topic on my YouTube channel for over a year now. In the meantime, I came across many people who (unfortunately) have bought in at a relatively high price. In this idea, we're looking at the effect of Dollar-Cost Averaging your position.
There are two examples here
You've bought your first 1000 Shares at $35.96 ($35960)
(1) You buy 1000 Shares at $10.39 ($10390) and end up with an average buy-in price of ~$23.80
(2) You buy 2500 Shares at $4.00 ($10000) and end up with an average buy-in price of ~$13.20
This is just an example. Of course, the numbers are individual.
This method is essential if you want to break even or close your position with some profits. This also requires capital management and some spare money.
If you're overinvested and have nothing left to lower your buy-in price, you need to stay calm & patient.
While we're looking at the weekly chart, we see three reasons in this chart for a possible trend-reversal
The price found support at $9.50, which is also the key level of the bullish pennant from Jan 21 to May 21
The Relative Strength Index (RSI) is printing a divergence. Buyers seem to be active in the market while the chart shows a lower low, mainly due to the recent fear & sell-off in the market. We've talked about the reasons in my previous ideas.
The ADX indicates an absent trend, similar to the price action at the end of 2020. Sellers might be exhausted at this point.
We could see two scenarios here
1. A retracement within the downwards trend to ~$19, followed by another sell-off and a lower low
2. A full trend change with the price moving past the $19 level and finding support here
Both scenarios require time for confirmation. For now, I'm long and I'll add some more to my position within the next days.
If you like this idea, please let me know by commenting or liking. Feel free to share your own idea in the comments as well. Also, check out the stuff below ⤵️

Update: ;AMC macro cycle TA TheoryFirst, please look closely. That green wave is, essentially the void. A place where the price has no sky limit except for the yellow dotted line connecting the peaks of the last two squeezes. The white has been used to keep price stable. Any halts we saw, i think, is due to fear from letting the price leave these lines of resistance. Inside the the purple is what they want. There is a top but no bottom. Perhaps the cycle is 'pull buy orders during the cross over' then when it enters the purple 'let it rip'. This can change of course, if ftds become too hot or the swaps place too much risk. If this happens, then you use the long wave across the top (also white) to act as an area of distribution. The scary thing for them is that eventually, there is an end.. but its so far down the line (2025) it works in their favor. There needs to be a catalyst.. something.. that breaks us out of the resistance otherwise we smooth sail until 2025

AMC short Does not look like the buy trade will make it.
Back to short and have pending order in at 7 if we get there.

AMCMID-TERM: Double bottom, wedge, bullish engulfing on daily, classic bullish divergence on RSI. (not financial advice)

