analysis on amc/downtrendGood morning! Today on amc our graph looks like a triangle. We have a breakout of the support line by a big candle with a large volume and also the breakout of the vwap indicator so we have a downtrend....
1AMC trade ideas

AMC Entertainment (NYSE: $AMC) Likely To Wick Thru 0.786 Fibs!🕯AMC Entertainment Holdings, Inc., through its subsidiaries, engages in the theatrical exhibition business. The company owns, operates, or has interests in theatres in the United States and Europe. As of March 1, 2022, it operated approximately 950 theatres and 10,600 screens. The company was founded in 1920 and is headquartered in Leawood, Kansas.

$AMC: Make Or Break⭐AMC is in a huge falling wedge starting from 30$
⭐Breakout of the falling wedge give us a target of 30$ +
⭐17.5$ Support needs to hold with significant volume
⭐MFI strongly oversold (Bullish Divergence, icoming?)
⭐Volume is lower than before while price is dropping (Bullish)
⭐Vix Fix Indicator strong signal of a bottom
⭐Ichimoku Cloud is green, which could indicate that price is about to make a reversal
⭐Break below 17.3$ (Daily close below) = Bearish
⭐Ichimoku Cloud support 17.3$ needs to hold with significant volume
⭐50K Open interest at 60$ (When 34$ is broken AMC should start running)
⭐Break 20$ (23.5k Open Interest and gamma will start having a positive effect on the price of AMC)

$AMC 50 day moving average test.Looking for a bounce off the 50ma over $20 this week on AMC, saw some bullish options activity friday, i like the R/R off this area.

DOGE $AMC correlation?Is DOGE predicting the $AMC price or $AMC predicting what is going to happen with DOGE?
The values to cultivate in trading You have to have a mind of steel
You must have a strong mind. In trading it's not every time you win, sometimes you also lose. However, you must learn from your losses and this will allow you to stop making the same mistakes. It is the same in our daily life where we often face certain difficulties, but what is important is to be able to get up and move forward to become champion. Each failure is an experience, so don't doubt yourself and don't underestimate yourself!! You have the potential within you to succeed whether in trading or in your everyday life. Be mentally strong.
Man's greatest weakness: Doubt
You should never doubt yourself. Doubt is considered the greatest weakness of human beings. You have to believe in yourself, in what you do.
Above all, don't doubt your analyses, always be optimistic, see things on the bright side and the good things will reach you. It' s a natural phenomenon...
Patience in trading
To be a good trader, you have to be really patient. What does this mean? This mean that you have to wait for the right moment after your analyzes to take a position. You have only one bullet in your rifle to be able to hit your target.
This is my modest contribution while hoping to receive from you as well. Thank you for your attention. Peace and love..God bless...

Analysis of AMC - Only intended to obtain Reputation pointsHello, everyone. As the title described, this analysis is not professional, is just a basic observation of the candles in the chart, anything can happen at any moment and change every direction and pattern.
Hope you all have a peaceful weekend. And I wish all luck to AMC traders and Holders.
Thanks in advance for the help given to help me access group chats.

AMC to the DIRTIts only a matter of time until Adam Arron's jig is up. And he won't be sad with $1.5B in the Bank. With the massive insider selling and the overall lack of retail sentiment, it's only becoming more evident even more the Meme crowd.

AMC LongStill looks like we have a little lower to go towards our .786 level. B wave up should be massive.

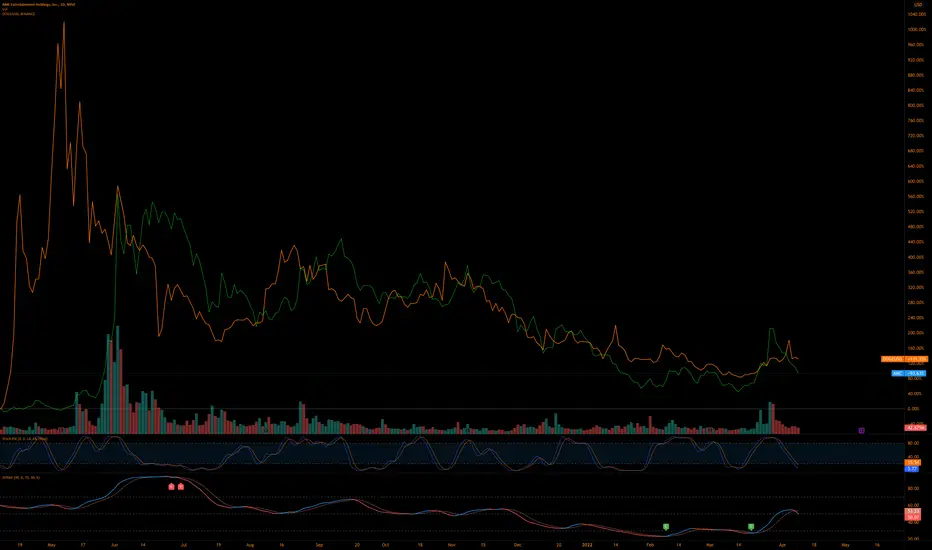
Pullback and spring effectWe have a pullback and spring effect on the vwap indicator so the market will go down.

AMC wedgeNYSE:AMC
The wedge is narrowing on the weekly chart...
Amc found resistance at the 50 and 200 day SMMA,
Can we aspect a death cross?
Perhaps we will test the stong support line at $14,82.
Curious, about the wedge breakout. Also curious at you perception of this situation.
Are you bullish or bearish on AMC?
This is no financial advice

AMC last support to squeezewe got rejected at 33.80$ where we got shorted by short sellers , now we have a last line of support to confirm the reversal which is above the 17.77$, if we hold we going to see an accumulation phase to test the first resistant around the 20.80$.

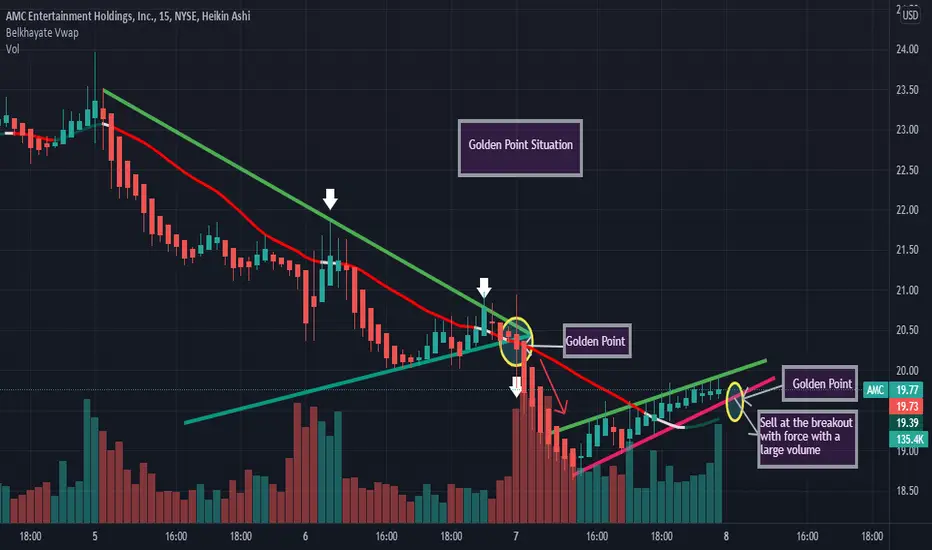
crossover between resistnace and support : golden point course on golden point
The golden point can be defined as the intersection between support and resistance . However, when they meet , its means he's going to get a pulse. The golden point can be considered as a strong signal...We have an example that you can see on the chart, we have a breakout with force the support line along with a large volume.
Lines, trendlines and channelsLines are one-dimensional figures that extend endlessly into a future and which connect the price segments on a chart. They are often used to determine a trend and particular support and resistance levels. Lines are easy to draw and use as technical tools. Over time, lines became implemented into various trading systems such as Andrews' Pitchfork and Gann Fan Lines. However, lines have countless more uses. For example, lines can be used to section particular parts of a price pattern. Additionally, they can be used to draw horizontal support and resistance levels. Lines also find utility in measuring the speed of the price ascend or descend. Furthermore, they can be deployed in various trading strategies and used to identify a trend.
Illustration 1.01
The picture above shows the daily chart of Microsoft Corporation stock. A simple dashed line (white) measures the percentual decline between 22nd November 2021 and 8th March 2022.
Trendline
The trendline is a simple line that connects prices across a chart. It reflects a primary trend in the prices of stocks, commodities, etc. Trendlines can be used to construct channels and numerous different bodies. In addition to that, trendlines can also act as resistance or support.
Illustration 1.02
Illustration 1.02 shows Lockheed Martin stock on the daily chart. It also shows the trendline (white) pointed to the upside as it cuts through a substantial portion of lows.
Channels
Channel can be constructed by two parallel trendlines, which act as support and resistance levels. A channel can be sloped upward or downward depending on the general trend of prices. When a channel is correctly determined and drawn, the price often moves between the two boundaries. However, occasional breakouts occur. As a result, they establish a new trend or validate a current one once the price returns to a channel.
Illustration 1.03
The image above shows the daily chart of gold. The channel (white lines/boundaries) can be observed as well. False breakout took place on 27th January 2022. However, the price retraced back into the channel on 9th February 2022.
Resistance and support levels
Often, a line or trendline acts as a particular support or resistance level. The function of these two levels is to halt price rise or decline. Typically, it is considered bullish when resistance is penetrated to the upside. Contrarily, when support fails to hold selling pressure and breaks, it is usually a bearish sign. Resistance and support can be drawn by a simple horizontal line. However, resistance and support can be at a slope. That is common, for example, for channels in a strong uptrend or downtrend. Generally, the significance of support or resistance grows with an increasing number of successful halts being put to a price rise or decline.
Illustration 1.04
Illustration 1.04 portrays the daily chart of Bitcoin. Major support and resistance levels are indicated by white horizontal lines. The first top also acts as the resistance of utmost significance as the price previously halted its rise at this level.
Speed lines
Speed lines are three consecutive lines used to estimate future support and resistance levels. In an uptrend, speed lines are constructed by creating a box connecting a low point in the lower-left corner and a high point in the upper-right corner. Next, a vertical line connecting these two points is sectioned at each third and in the middle. Then a speed line is drawn from the actual low in the lower-left corner through the right side of a box where sections were marked. These speed lines are extended into the future and considered to estimate natural support and resistance levels. Modern techniques include creating speed lines, such as sectioning a box according to Fibonacci ratio numbers.
Illustration 1.05
The picture above shows Tesla stock on the daily chart. It also shows the unconventional construction of speed lines from a box cut into four equal sections.
Disclaimer: This content serves solely educational purposes.

Amc We did break both trend ideas but I have Been waiting patiently for 1925. We went a bit lower but I loaded up at 19.11. This is a short term swing idea. Doable and we can make quick money. Not looking for 50$ or 100$ price tag. This is reasonable trade. Idea is 19.25 -19.11 entry. Sell into a pop above 20.50s to 21.15. This could backtest that previous support uptrend as resiatnce. Could try to short there if we can’t reclaim or push above. I’m long now will stop out of o see us roll over and lose last low and start flagging under it. Good luck

AMC Shakeout AMC Currently retesting falling wedge breakout on diminishing bearish volume.
RSI showing bullish divergence.
OBV breakout on 2 hour chart.
MACD overdue for a reversal on multiple time frames.
MM's just banked on cheap put options after running this to $34 and halting back down. Now they will gladly take your long calls that they trapped retail on for pennies on the dollar. This is the game!
This is a final shakeout IMO. NFA
