AMC head and shoulders forming, but $20 first. the 618 retracement should happen.. and it'll be deadly when this plays out, goodluck to all!
1AMC trade ideas

$20 this week for amc possibly. just a thought im gonna throw out there. its not impossible, id say a 7% chance

AMC Entertainment Holdings Options Ahead of EarningsIf you haven`t sold AMC before the APE merger, after which it went down on share dilution:
Then analyzing the options chain and the chart patterns of AMC Entertainment Holdings prior to the earnings report this week,
I would consider purchasing the 3.50usd strike price Calls with
an expiration date of 2024-5-17,
for a premium of approximately $0.37.
If these options prove to be profitable prior to the earnings release, I would sell at least half of them.


Chronicle of a Foretold Pump/DumpPump/Dump schema:
Discrete Share accumulation.
Broadcasted Triggering Event (news, rumors, forums, etc).
Gather the mass of "Bagholders".
Dump all the load.
Pocket the quick profit.
I am not a fan of " meme stocks " because they're very much like penny stocks, prone to pump/dump schemes. How legal or illegal is this practice?, it is not us to decide, there are authorities who are supposed to regulate these behaviors.
Regardless of the morality of a it we can analyze the radiography of the move. Using the volume bars feature, you can see "big fat" candles on the accumulation phase, the "rumor" phase where the "roaring kitty" name was heard in the news, the spike and immediately took the stock to a quick profit of +120% overnight, and the fade phase, where the only thing that remained at the end was the frozen smile of the hopeful bagholders with a fading volume.
#LearnToEarn.
Be careful where you put your money, trading and investing requires knowledge of the company, its balance sheet, fundamentals and/or technical metrics. Don't follow the crowd, else you'll end up in the slaughter house. There's no free lunch in Wall St.
Let's remember this quote: "The game of speculation is the most uniformly fascinating game in the world. But it is not a game for the stupid, the mentally lazy, the person of inferior emotional balance, or the get-rich-quick adventurer. They will die poor." Jesse Livermore.

To the MoonMeme season has just began. Plan on selling in 15-20 days. Let's see what the waiting will come down to. I expect at least one more move like this.

AMC: Technical Buy, but Fundamental WatchFundamentals:
The company had some improvement in its bottom line
Technicals:
AMC was clobbered, but now there is a technical buy signal.
Stage 2 ichimoku buy signal
u1v Crown pattern DQ validation


amc $39 is the next leg up on amc.. brace yourselves..we have been a little bit right so far... lets hope we are right again!

AMC Entertainment Holdings Stock.DAILY ANALYSIS.Hello ladies and gentleman,according my analysis To AMC Entertainment Holdings STOCK .there is agreat probability long to 10 USD.

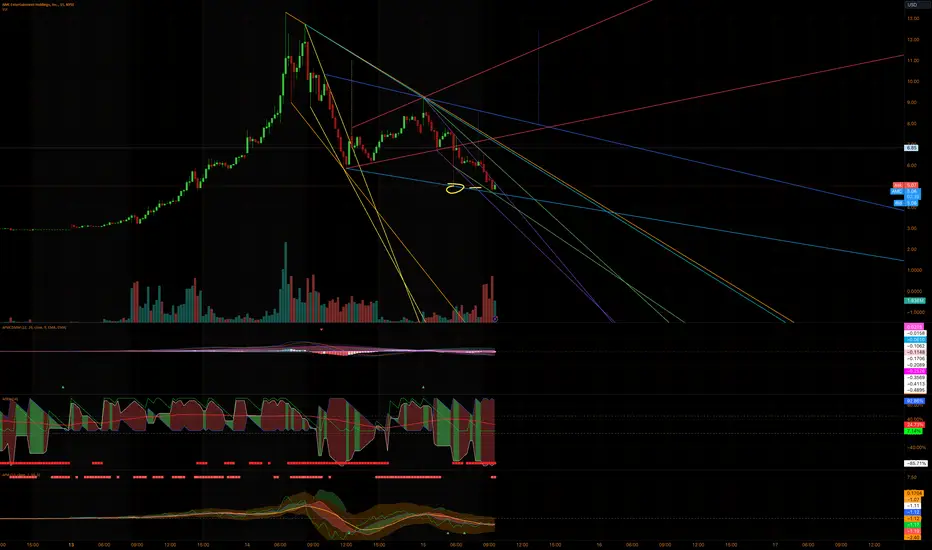
AMC BUY- Scalp05-16-2024
NYSE:AMC
BUY $4.84
SELL $6.22
ASK $1.38
There are restriction on how much you can set your target price on my platform, so I’m looking for a small move.

Past is the FutureIn this chart, it is pretty straight forward. I saw a similarity in the patterns highlighted. Maybe I'm just looking too hard.
Though if you were to assume the same move on a different skew It lines up really well.
I know you can take bars patterns, I really wish you could skew those bars patterns on an angle.
It is what it is, look forward to the price action...

AMC Gamma Squeeze/Short SqueezeOkay I had to hop on this and chart for you guys because there is a lot, and I mean TON of charts right now that do not make any sense.
SHORT TERM THESIS : Anyways, so far price seems to be stable floating above 30 min 200 EMA and take note. There is a fib level at 5.13 . As long as we don't fall past current support levels, this could really take off tomorrow. We are currently in a short term downtrend that seems to be holding well above $5.
WEEKLY : From a weekly perspective, we could possibly see $94 soon. My reasoning for that are weekly fib levels that are 3 years old. From 2021 highs to 2024 lows, your next fib level is $94. These are just technicals, and thats IF it all pans out correctly. The only thing is, you need to hold. HOLD harder than you ever held before. I'm not asking you to put your life savings in there. All I am saying is to hold the line. Shorts will try to manipulate you every way possible. News, bots, negative sentiment, analyst ratings, etc.. they are all bullshit.
HALTS : Do not be afraid of them, its just the big man telling us "hey you guys need to relax." Again, they will keep halting. Do not relent and do not be afraid. GME ran even after halting several times. It does not affect the trend.
If deepfuckingvalue AKA kitty is in this, just remember who he is. He is one of the greatest investors of all time. His P/L speaks for him. He led the charge and he currently leading the charge. Do not relent. IN DFV WE TRUST

the fraud in amc is at an all time highits not just technical analysis, its fraudulent behavior. everything is rigged against you.

amc is on track to a great bull run.. explosive move.my target is $130. but input changes everyday, we are on track to getting a golden cross within the next 2 months. Cheers

AMC bulls take control after 896 days of pain🔥boost and follow for more ❤️🔥 AMC is finally breaking trend resistance, we could possibly see a 1,500%+ rally from here in the longterm, 100-200% short term..
meme stocks are back, small cap summer.. SPY is breaking out.. we are so back baby! lfg, see yall soon with more ideas 🔥

AMC will moveI like it when AMC moves because what they do is a very precise technical play; it can go down or up, and you can find these points to hop on the train and know that another big rise is coming.
We have a bull flag here!

AMC will moveI like it when AMC moves because what they do is a very precise technical play; it can go down or up, and you can find these points to hop on the train and know that another big rise is coming.
We have a bull flag here!
amc.. and roaring kitty a rant.this is a controlled pump man, i cant stress it enough. please be careful and just be zen

$7.44 & the $11 for AMC Quick levels & Angles show future possible targets.
Be careful its still a meme stock :)

AMC and GME Gamma Squeeze vs Short Squeeze durationYou are surely wondering how long this rally on GME and AMC could go!
Let's look at the 2021 short / gamma squeezes to find out!
GME rallied from Jan 13 to Jan 28 for 15 days and went up 24X at its peak! That was a gamma squeeze!
AMC, on the other hand, rallied from May 13 to June 2 for 20 days, during which it went up 6X at its peak. That was more of a short squeeze!
A gamma squeeze and a short squeeze are both market phenomena, but they operate in different ways and involve different types of trading strategies.
Short Squeeze:
In a short squeeze, traders who have sold a stock short (i.e., they've borrowed shares and sold them with the intention of buying them back later at a lower price) are forced to buy the stock back at higher prices to cover their positions. This buying pressure drives the stock price even higher, causing more short sellers to cover their positions, thus further increasing the price. It creates a feedback loop where rising prices force short sellers to buy, further increasing demand, and thus prices.
Short squeezes often occur when there's significant negative sentiment or speculation about a stock, and a sudden positive development causes the price to rise sharply, catching short sellers off guard.
Gamma Squeeze:
A gamma squeeze, on the other hand, involves options trading. It occurs when option sellers (who are often large institutional investors or market makers) have sold call options (contracts that give the holder the right to buy a stock at a certain price) and need to hedge their positions by buying the underlying stock. As the stock price rises, they need to buy more stock to maintain their hedge, which further fuels the price increase.
Gamma squeezes are typically triggered by a sharp rise in the underlying stock price, causing the delta (the rate of change of the option price with respect to the price of the underlying asset) of the call options to increase rapidly. This forces option sellers to buy more stock to adjust their hedges, leading to a feedback loop similar to a short squeeze but driven by options trading.
We could be entering a cycle here, let's see!

golden cross on amc is in the works... the bull run begins.huge moves are coming, huge gains will be made. patience, and dont be overleveraged. goodluck guys

next leg up is $37 on amc... then the 3rd leg would get us 130this is speculation, as it always has been. my calls are loaded and im deep in the money. fomo is a drug... capitalize on it!
