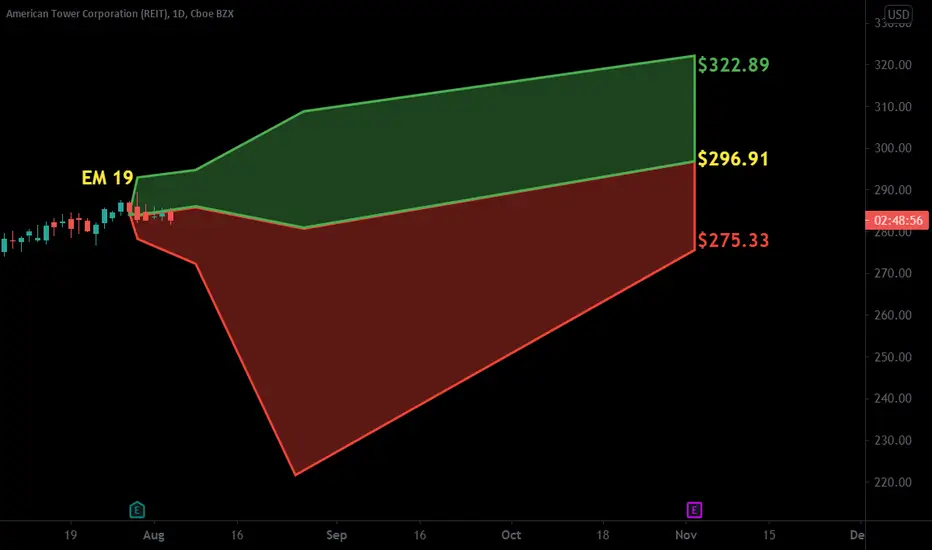
$AMT with a Bullish outlook following its earnings #Stocks The PEAD projected a Bullish outlook for $AMT after a Positive under reaction following its earnings release placing the stock in drift A with an expected accuracy of 73.43%.
1AMT trade ideas

AMT | American Tower | REITAmerican Tower Corporation, one of the largest global REITs, is a leading independent owner, operator and developer of multitenant communications real estate with a portfolio of approximately 219,000 communications sites. For more information about American Tower, please visit the Earnings Materials and Investor Presentations sections of our investor relations website at www.americantower.com.

$AMT with a Bullish outlook following its earnings #Stocks The PEAD projected a Bullish outlook for $AMT after a Positive Under reaction following its earnings release placing the stock in drift A with an expected accuracy of 83.33%.

Tight Squeeze in American TowerMost members of the S&P 500 closed lower on Friday. Today we’re looking at one of the gainers: American Tower.
A few interesting patterns appear on this daily chart of the wireless-tower operator.
First is the narrowing consolidation between the 50-day simple moving average (SMA) and 200-day SMA. Bollinger Band Width has tightened to its closest range since August. Does that create the potential for a breakout?
Second, prices showed signs of escaping the range by closing above a falling trendline on Friday.
Next, consider how AMT made a higher low in mid-June despite the broader market hitting a new 52-week low. That’s a potential sign of relative strength.
Fourth, the 50-day SMA is nearing a potential “golden cross” above the 200-day SMA.
Finally, the broader Real Estate sector could potentially benefit if Treasury yields continue to slide.
TradeStation has, for decades, advanced the trading industry, providing access to stocks, options, futures and cryptocurrencies. See our Overview for more.
Important Information
TradeStation Securities, Inc., TradeStation Crypto, Inc., and TradeStation Technologies, Inc. are each wholly owned subsidiaries of TradeStation Group, Inc., all operating, and providing products and services, under the TradeStation brand and trademark. You Can Trade, Inc. is also a wholly owned subsidiary of TradeStation Group, Inc., operating under its own brand and trademarks. TradeStation Crypto, Inc. offers to self-directed investors and traders cryptocurrency brokerage services. It is neither licensed with the SEC or the CFTC nor is it a Member of NFA. When applying for, or purchasing, accounts, subscriptions, products, and services, it is important that you know which company you will be dealing with. Please click here for further important information explaining what this means.
This content is for informational and educational purposes only. This is not a recommendation regarding any investment or investment strategy. Any opinions expressed herein are those of the author and do not represent the views or opinions of TradeStation or any of its affiliates.
Investing involves risks. Past performance, whether actual or indicated by historical tests of strategies, is no guarantee of future performance or success. There is a possibility that you may sustain a loss equal to or greater than your entire investment regardless of which asset class you trade (equities, options, futures, or digital assets); therefore, you should not invest or risk money that you cannot afford to lose. Before trading any asset class, first read the relevant risk disclosure statements on the Important Documents page, found here: www.tradestation.com .


$AMT with a Bullish outlook following its earnings #Stocks The PEAD projected a Bullish outlook for $AMT after a Positive over reaction following its earnings release placing the stock in drift B with an expected accuracy of 54.55%.

$AMT with a Bullish outlook following its earnings #Stocks The PEAD projected a Bullish outlook for $AMT after a Negative over reaction following its earnings release placing the stock in drift C with an expected accuracy of 100%.

Short on a different American. AMTGoals 220, 210.
We are not in the business of getting every prediction right, no one ever does and that is not the aim of the game. The Fibonacci targets are highlighted in purple with invalidation in red. Fibonacci goals, it is prudent to suggest, are nothing more than mere fractally evident and therefore statistically likely levels that the market will go to. Having said that, the market will always do what it wants and always has a mind of its own. Therefore, none of this is financial advice, so do your own research and rely only on your own analysis. Trading is a true one man sport. Good luck out there and stay safe

American Tower Corporation close to being bullishAmerican Tower Corporation is an American real estate investment trust and an owner and operator of wireless and broadcast communications infrastructure in several countries worldwide

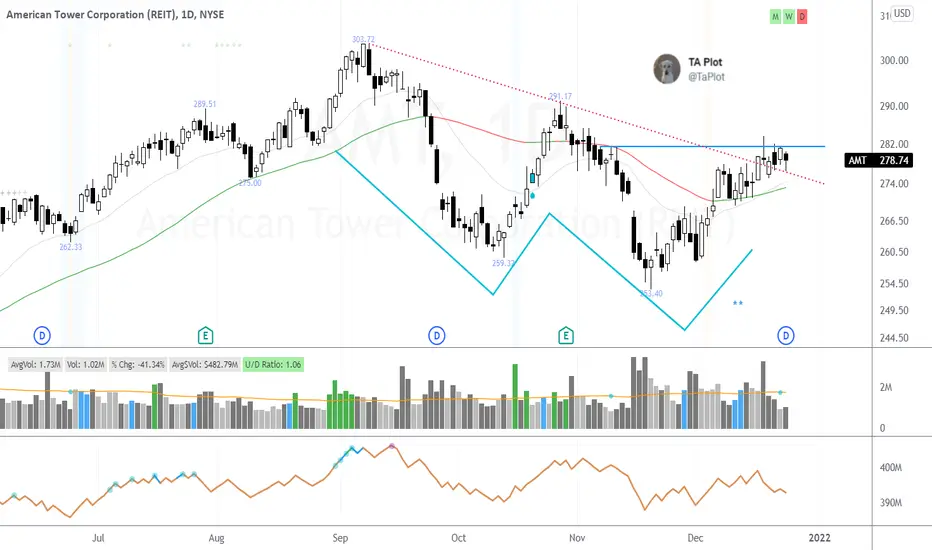
$AMT Double Bottom Pattern Setup$AMT setting up a potential double bottom setup with traditional pivot around $291.27
In the network/wireless space which is showing strength lately.
I am more interested in a potential early entry with a pivot developing after breaking down trendline (red dots on chart).

AMT: - real estate long only I have always enjoy instruments like fixed income or long only where it is enough just to find an entry point below and buy in addition if you entered early.
As you can see on the chart, the indicators indicate that the price is currently in the oversold corridor, so I bet on growth.
___
Sincerely,
AJV


BULLISH OPENING ON AMTi will be long on AMT we are on a nice support area i think it will go 276.4 area in order to fill gaps and come back to equilibrium area


AMT , LONG AMT , retakes 10 and 21 ema and we have some rising volume signs . Another institution favorite .
Last play I will publish for a bit till some of todays ideas either get stopped out or I'm able to sell half at 2R to manage risk .
Long 128.15 vs 278.50

$AMT with a Bullish outlook following its earnings #Stocks The PEAD projected a Bullish outlook for $AMT after a Positive over reaction following its earnings release placing the stock in drift B
If you would like to see the Drift for another stock please message us. Also click on the Like Button if this was useful and follow us or join us.
AMTStrong uptrend with price action making HH and HL.. Wait for retracement back to the previous resistance zone

Golden Crosses in Wireless Tower StocksWireless-tower stocks have been in long-term uptrends as mobile devices and usage proliferate. American Tower is the largest of the three, followed by Crown Castle International and SBA Communications .
AMT has moved sideways for the last year. It hit an all-time high shortly before the coronavirus crash, quickly rebounded and then drifted sideways. Prices declined once bond yields started rising in September. (Not a surprise because AMT is a REIT.)
The stock had a sharp rebound in March and April, followed by consolidation this month. The most important chart pattern is the 50-day simple moving average (SMA) rising above the 200-day SMA. That’s a “Golden Cross,” a signal that longer-term momentum has turned bullish.
Also notice the $244 area. It was support last June and August, resistance in October and November and now is offering support again.
It’s also noteworthy that CCI already had its golden cross in April and has now broken out to new highs. For SBAC, the signal is on the verge of taking place.
TradeStation is a pioneer in the trading industry, providing access to stocks, options, futures and cryptocurrencies. See our Overview for more.
Crown Castle daily chart:
SBA Communications daily chart:

$AMT with a Bullish outlook following its earnings #Stocks The PEAD projected a Bullish outlook for $AMT after a Positive under reaction following its earnings release placing the stock in drift A
If you would like to see the Drift for another stock please message us. Also click on the Like Button if this was useful and follow us or join us.

MATRIX portfolio AMT/USD : Smart money levelsNo description needed.
I just spot where the value should be or where are the levels smart-money and institutionals traders and investors look for buy entry's, according to Fibonacci retracements.
NOT FINANCIAL ADVICE
MORPHEUS.

Pull Back Fishing Falling WedgeFalling wedges can be bullish when price breaks up and out of the upper trendline.
Not a recommendation.
Looks like a cup and handle pattern is also forming

$AMT with a Bearish outlook following its earnings #Stocks The PEAD projected a bearish outlook for $AMT after a Negative under reaction following its earnings release placing the stock in drift C
If you would like to see the Drift for another stock please message us. Also click on the Like Button if this was useful and follow us or join us.
