AMZN: Consolidating Below Resistance🔥 LucanInvestor's Strategy:
🩸 Short: Below $222.19, targeting $215 and $210. Bearish MACD momentum suggests caution near key support.
🩸 Long: Above $226.26, aiming for $230 and $240. A breakout above resistance would confirm bullish momentum.
🔥 LucanInvestor's Commands:
🩸 Resistance: $226.26 — A critical level for bulls to confirm upward momentum.
🩸 Support: $222.19 — Immediate support; breaking below could lead to a retest of $215.
Amazon (AMZN) is consolidating near key resistance at $226.26, with MACD showing weak but stabilizing momentum. The price is above the 9-day EMA ($222.19), signaling recovery, but sustained volume is required for a bullish breakout. A failure at resistance may result in a short-term pullback.
👑 "Master the range, and you’ll master the trade." — LucanInvestor
1AMZN trade ideas

AMAZON Bullish Flag Pattern! Buy!
Hello,Traders!
AMAZON is trading in an
Uptrend and the stock
Has formed a bullish flag
Pattern so IF we see a
Bullish breakout then we
Will be expecting a
Further bullish continuation
Buy!
Comment and subscribe to help us grow!
Check out other forecasts below too!

AMZN Consolidates Before Key Moves! Trade Setups to Watch
Analysis:
AMZN is trading within a well-defined ascending channel, showing resilience near the $220 level. The stock has faced consistent resistance at $227-$230, as indicated by strong call walls in GEX data. The MACD is slightly bearish, with momentum waning, while the Stochastic RSI indicates oversold conditions, suggesting a potential bounce.
Volume remains steady, reflecting a wait-and-see attitude among traders, with key levels acting as a magnet for price action.
Key Levels to Watch:
* Resistance Levels:
* $227-$230: Significant resistance zone with the highest GEX levels.
* $233: Psychological resistance, aligning with extended targets.
* Support Levels:
* $217.50: Immediate support zone.
* $215: Critical level, aligning with strong put walls.
* $210: Final downside support before significant selling could accelerate.
GEX Insights:
* Gamma Exposure (GEX):
* Positive GEX peaks near $227-$230, creating strong resistance to upside momentum.
* Negative GEX levels around $215 provide a critical support floor.
* Options Activity:
* IVR: High at 56.4, signaling elevated implied volatility.
* Call/Put Ratio: Calls remain subdued at 13.2%, indicating bearish positioning.
Trade Scenarios:
Bullish Scenario:
* Entry: Break above $227 with strong volume.
* Target: $230 (first target), $233 (extended target).
* Stop-Loss: Below $220.
Bearish Scenario:
* Entry: Break below $217.50 with increasing selling pressure.
* Target: $215 (first target), $210 (extended target).
* Stop-Loss: Above $222.
Directional Bias:
AMZN is range-bound, with a cautiously neutral to bearish bias. A breakout above $227 or breakdown below $217.50 will likely signal the next major move.
Actionable Suggestions:
* For Scalpers: Trade within the $217.50-$227 range until a clear breakout or breakdown occurs.
* For Swing Traders: Monitor key zones around $215-$230 for directional trades.
Disclaimer: This analysis is for educational purposes only and does not constitute financial advice. Always do your own research and manage your risk before trading.


AMAZON: Neutral on 1D signals a buy opportunity.AMAZON is neutral on its 1D technical outlook (RSI = 52.618, MACD = 1.360, ADX = 32.455) and is trading under its 4H MA50. With the long term pattern being a Channel Up and the price already hitting its bottom, this emerges as a medium term buy opportunity. The Channel's pullback has already met the 0.382 Fibonacci retracement condition, which is the level all three prior pullbacks hit before rebounding on a new bullish wave. Those waves hit at least the -0.382 Fibonacci extension on their way up, so that is our target (TP = 247.00).
See how our prior idea has worked out:
## If you like our free content follow our profile to get more daily ideas. ##
## Comments and likes are greatly appreciated. ##

Amazon Stock Analysis: Navigating the Path Between E-Commerce
Amazon Stock Analysis: Navigating the Path Between E-Commerce Strength and Market Volatility
Introduction
Hello, traders and investors! It’s Denis Mikheev from TheWaved™, here to deliver an in-depth analysis of Amazon’s stock (NASDAQ: AMZN). With the help of our premium tools and techniques, we’re diving deep into technical, VSA, and fundamental analysis to uncover the best strategies for the upcoming market movements. Let’s break down what’s happening with AMZN and set clear targets for trading this powerhouse of e-commerce.
Recent Performance and Market Context
Amazon’s current price sits at $219.27, with a noticeable decline from its 2024 absolute high of $233. This 5.89% drop aligns with recent sell-offs driven by macroeconomic headwinds and profit-taking from the December highs.
The stock is trading in a consolidation phase, sitting between strong support zones at $214.99 and $209.11 and resistance levels at $223 and $228. With the broader NASDAQ index displaying mixed momentum, Amazon remains a critical stock to watch.
Support Levels:
-
1. 214.99
2. 209.11
3. 198.78
4. 182.62
5. 177.95
Resistance Levels:
-
1. 214.99
2. 209.11
3. 198.78
4. 182.62
5. 177.95
Powerful Resistance Levels:
-
1. 180.095
2. 151.49
3. 116.04
4. 87.57
Technical Analysis: Key Levels and Trends
Support Levels: 214.99, 209.11, 198.78
Resistance Levels: 223.00, 228.00, 233.00
Key Moving Averages:
- MA50 (Hourly): 220.01
- MA200 (Hourly): 223.16
RSI Insights: The RSI-14 currently reads 52.91, indicating a neutral market condition but leaning towards bullish potential on strong volume signals.
These technical indicators suggest price consolidation, but with bullish potential as the RSI edges upward and MA200 looms as a key dynamic resistance level.
Volume Spread Analysis (VSA): Detecting Market Intentions
Analyzing VSA patterns from recent trading sessions reveals mixed signals. A notable “Buy Volumes Take Over” pattern on January 10 suggested short-term buying strength, but was quickly followed by a reversal due to increased sell volumes. This signals that smart money may be accumulating positions before a larger move.
Price Action and Patterns
On January 6, a strong “Buy Volumes Max” pattern indicated bullish intentions, but resistance at $228.23 capped further growth.
On January 7, a “VSA Sell Pattern 3rd” hinted at a bearish reversal, driving prices back to support levels.
Key takeaway: The interaction between support at $214.99 and resistance at $223 will be pivotal in determining the next directional breakout.
Fundamental Factors to Watch
Amazon’s fundamentals remain strong, with steady revenue growth driven by AWS (cloud services) and robust e-commerce performance during the holiday season. However, rising interest rates and inflationary pressures continue to dampen consumer spending and could act as a headwind.
Trading Plan: Targets and Stop-Loss Levels
Based on the current setup, here’s a practical trading roadmap:
Short-Term Bullish Scenario:
Entry: Above $223 after confirmation of a breakout.
Targets: $228, $233.
Stop-Loss: $220.
Bearish Alternative:
Entry: Below $214 with strong bearish candles.
Targets: $209, $198.78.
Stop-Loss: $217.
Forecast: Where Are We Headed?
In the short term, Amazon is poised for a potential bullish breakout if it clears resistance at $223. However, caution is warranted if macroeconomic conditions shift. Our long-term view remains cautiously optimistic, with a forecast targeting $240+ by Q2 2025 as the broader market stabilizes.
Conclusion and Call to Action
This analysis is powered by TheWaved™, utilizing advanced tools and methodologies. If you have any questions or want a deeper dive into our methods, feel free to reach out via direct messages. Remember, all the professional indicators and insights are available in the profile header. Follow for more ideas, and let’s trade smarter, not harder!
Concept of Rays
Explanation of the "Rays from the Beginning of Movement" Concept
Core Idea
My proprietary analysis method is based on using rays constructed on Fibonacci mathematical and geometric principles. These rays create a system of dynamic levels that help predict precise asset movements and identify key zones where price interactions occur. Price interaction with these rays signals probable scenarios: either a reversal or a continuation of movement, but only after interaction and the appearance of dynamic factors and patterns.
Why Predicting Specific Levels is Not Possible
Financial markets are nonlinear systems, where price movement is determined by numerous variables, including market volumes, liquidity, macroeconomic factors, and participant psychology. Instead of attempting to predict specific levels, I propose analyzing probabilities of price reaction at pre-calculated key zones. Price interaction with rays provides additional insights into the direction and strength of movement.
Stay sharp, trade safe, and may the markets favor your strategy!

AMZN: Testing Support Levels Amid Mixed Signals🔥 LucanInvestor's Strategy:
🩸 Short: Below $215.36, targeting $215 and $205. Weakening MACD momentum and the price nearing the 200-day EMA support the bearish case.
🩸 Long: Above $220.91, targeting $225 and $230. A strong rebound from the 9-day EMA could trigger upside momentum, but it would require notable bullish volume.
🔥 LucanInvestor's Commands:
🩸 Resistance: $220.91 — A key level where rejection has occurred, marking the boundary for bullish recovery.
🩸 Support: $215.36 — A significant level to watch; its breakdown could lead to accelerated selling pressure toward lower targets.
Amazon (AMZN) is in a consolidation phase, with the MACD showing a neutral-to-bearish outlook and price action testing key support near $215. The 9-day EMA is trending below the 200-day EMA, indicating bearish pressure. Volumes remain moderate, signaling caution for both sides.
👑 "When the market hesitates, discipline dominates the game." — LucanInvestor

AMAZON Will Keep Growing! Buy!
Hello,Traders!
AMAZON is trading in a
Strong uptrend along the
Rising support line so
After the retest of the
Support we will be expecting
A further bullish move up
Buy!
Comment and subscribe to help us grow!
Check out other forecasts below too!

AMZN Approaches Resistance! Can Bulls Push Through? Jan. 14Technical Analysis Overview:
4-Hour Chart:
* Trend: AMZN has recently rebounded from its lower trendline, showing early signs of stabilization.
* Indicators:
* EMA (9/21): Price is testing the 9 EMA, while the 21 EMA is still above, acting as dynamic resistance.
* MACD: Displays a potential bullish crossover, but momentum remains weak for now.
30-Minute Chart:
* Price Action:
* Consolidation near $217-$219 indicates a battle between buyers and sellers.
* Resistance lies around $220, coinciding with the highest positive NETGEX level.
* Volume: Volume remains subdued, signaling the need for stronger participation to break resistance.
Key Levels to Watch:
Support Levels:
* $217: Immediate support and gamma level.
* $212.5: Strong PUT support zone.
Resistance Levels:
* $220: Key gamma resistance (highest positive NETGEX level).
* $227.5: Next resistance level, coinciding with GEX7.
* $230-$233: Strong CALL walls, marking major upside barriers.
GEX Insights:
Key Gamma Levels:
* Positive Gamma Walls (Resistance):
* $220: Highest positive NETGEX and immediate resistance.
* $227.5: 57.28% GEX7.
* $230: 83.61% (2nd CALL Wall).
* Negative Gamma Levels (Support):
* $212.5: Significant PUT support (-16.14% GEX).
* $202.5: 3rd PUT Wall (-4.5% GEX).
Options Metrics:
* IVR: 66.2, signaling moderate implied volatility.
* IVx: 37.5, slightly below average, suggesting mild price fluctuations.
* Call/Put Bias: Calls represent 12.3%, highlighting a neutral to bearish sentiment.
Trade Scenarios:
Bullish Scenario:
* Entry: Above $220 with volume confirmation.
* Target: $227.5-$230.
* Stop-Loss: Below $217 to control risk.
Bearish Scenario:
* Entry: Rejection at $220 or failure to sustain above.
* Target: $212.5-$210.
* Stop-Loss: Above $227.5 to avoid extended losses.
Directional Bias:
* The near-term outlook for AMZN hinges on whether it can decisively break above $220. Bulls need strong volume to overcome gamma resistance, while bears will likely defend this level aggressively.
Conclusion:
AMZN is at a critical inflection point around $220. Traders should watch for a breakout or rejection at this level to determine the next move. The gamma landscape highlights $227.5 and $230 as significant resistance zones, with $212.5 providing strong support.
Disclaimer:
This analysis is for educational purposes only and does not constitute financial advice. Always conduct your research and trade responsibly.

AMAZON SUPPORT CLUSTER|LONG|
✅AMAZON is trading in an
Uptrend and the stock is
Now making a local correction
But will soon hit a support
Cluster of the rising and
Horizontal support lines
Around the 213.83$ area
So we are bullish biased
And we will be expecting
A further bullish move up
LONG🚀
✅Like and subscribe to never miss a new idea!✅

AMZN ready for 8 % drophi traders,
AMZN shows obvious signs of distribution, lower high after lower high.
The price may be ready to roll down.
An 8 % drop is very probable.
Not edge for bulls here so I'm expecting bears to take control very very soon.
p.s. Enter short once the break down occurs.
Good luck

AMZN critical Weekly/Daily Channel, bull flagWatching this critical point of control area where the Weekly and the Daily bullish channels, If we lose the daily channel, we may see a draw down to $180 area
Current Support seems to be $210 for a bounce this week

Amazon bull flagAmazon has formed a bull flag , consolidation pattern ahead of Q4 earnings. I'm looking at a target of $255 by mid-April.
-Vince

Just support levels play on AMZNright now price is at support so you can get on long
right now price is at support so you can get on long
right now price is at support so you can get on long
right now price is at support so you can get on long
right now price is at support so you can get on long

BUY AMZNAMZN has created new all time high's.
Looking for retracement back to the previous resistance of $190.
The $190 level should act as support during a retracement.
The bullish trendline was established back in January of 2023. I'lll be looking at price action to determine actual entry.
My plan is to purchase shares or leaps based on price action, and if/how it pulls back to the $190 area.

A Reversal on Amazon. AMZNAlways a purely technical approach, while trading is examined. A few factors to suggest a reversal play here, and we have a double divergence on RSX momentum, diminishing volumes on the profile, apparent Elliot flat possibly in motion and a triple drive completion in position of Wave B of the flat. Inherently, reversal plays come with a higher risk nearly always, yet can be quite profitable at times. Volatility, stochastic oscillators are suggestive on the weekly chart.
We are not in the business of getting every prediction right, no one ever does and that is not the aim of the game. The Fibonacci targets are highlighted in green or purple with invalidation in red. Confirmation level, where relevant, is a pink dotted, finite line. Fibonacci goals, it is prudent to suggest, are nothing more than merely fractally evident and therefore statistically likely levels that the market will go to. Having said that, the market will always do what it wants and always has a mind of its own. Therefore, none of this is financial advice, so do your own research and rely only on your own analysis. Trading is a true one man sport. Good luck out there and stay safe.

A New Look At The 3 Step Rocket Booster StrategyWhat you will learn:
-Imagine a strategy that can help you find the best stocks to trade
-A new way to understand trend analysis
-Because its hard to hold a position you will learn the best margin level to use
To learn more watch this video
showing you what makes NASDAQ:AMZN
A good buy
But hurry and watch this video and understand this strategy
before the earnings report on 30th January 2025
Rocket boost this content to learn more.
Disclaimer:Trading is risky please learn risk management
and profit-taking strategies
And feel free to use a simulation
trading account before you trade with real money.

Amazon Inc. (AMZN): Consolidation Near Key Levels, Awaiting Bre🔥 Potential Price Targets (Next Month):
🩸 Near-term Goal: $230.00
🩸 Long-term Goal: $240.00
🔥 LucanInvestor’s Strategy:
🩸 Long: Above $223.38, targeting $230.00 and $240.00. Momentum supported by strong volume required for confirmation.
🩸 Short: Below $215.36, aiming for $210.00 and $200.00. Bearish MACD suggests downside potential if support fails.
🔥 LucanInvestor’s Commands:
🩸 Resistance: $223.38 – Breaking this level may lead to a continuation toward $230.00.
🩸 Support: $215.36 – A breakdown could pave the way for further declines.
Analysis:
Amazon is consolidating within a tight range. MACD remains neutral but hints at a potential bearish crossover. The stock is trading above its 200-day EMA ($190.96), suggesting a long-term bullish sentiment. However, failure to sustain above $223.38 could indicate a reversal. Watch for decisive moves to determine the next trend.
👑 "The market rewards those who plan ahead, not those who hesitate." — LucanInvestor

The "13 EMA" System Explained On This Price ActionThe journey of a thousand kilometres
begins with one step. Capitalism is not easy
but its possible there are
four factors of production
and capital is one of them.
The challenge is that some people
still believe in "Majic" Money
Honestly, such a thing is not real
the only thing close to that is credit
or getting money on a loan from a bank
or a hard money lender
otherwise, you will have to labour
either for free or for money
Now if you look at this chart
NASDAQ:AMZN
Notice the Bollinger bands?
I am using a 13 EMA on the Bollinger bands
when the price is below that 13 EMA it is showing
you low volatility
This is when you want to enter your
position at low volatility
This strategy is called"Dip Buying"
an idea I got from Tim Sykes.
Buying at a low volatility will
give you a chance to buy
the price at a cheap value
Before it gaps up *step #3 of the rocket booster strategy
or has a rally going upwards.
*To learn more about the rocket boost
strategy check out the references below.
You really just have to be patience
when dealing
with this kind of price movements
Rocket boost this content to learn more
Disclaimer: Trading is risky
please learn risk management
and profit-taking strategies
also feel free to use a simulation trading tool
before you
trade with real money.

Amazon I Strong Growth Projections - Next Long Opportunity Welcome back! Let me know your thoughts in the comments!
** Amazon Analysis - Listen to video!
We recommend that you keep this pair on your watchlist and enter when the entry criteria of your strategy is met.
Please support this idea with a LIKE and COMMENT if you find it useful and Click "Follow" on our profile if you'd like these trade ideas delivered straight to your email in the future.
Thanks for your continued support!Welcome back! Let me know your thoughts in the comments!

Amazon.com, Inc. (AMZN): Consolidating Near Critical Levels🔥 LucanInvestor’s Strategy:
🩸 Long: Above $223.72, targeting $230 and $235. A breakout needs volume support for sustained upside.
🩸 Short: Below $215.36, aiming for $210 and $205. A breakdown could trigger further corrections.
🔥 LucanInvestor’s Commands:
🩸 Resistance: $223.72. A breakout may ignite a rally toward $230.
🩸 Support: $215.36. A breakdown could lead to bearish momentum toward $210.
Amazon is stabilizing after a recent pullback. MACD shows waning momentum, hinting at possible volatility ahead. Traders should focus on breakouts or breakdowns from these key levels to define their strategies.
👑 "Adaptation defines success in dynamic markets." — LucanInvestor

Amazon (AMZN) - Bullish Continuation Trade Idea- AMZN is trading within a well-defined ascending channel, respecting both upper and lower trendlines.
- A recent breakout from a triangle consolidation pattern suggests potential continuation of the uptrend.
- The price is currently testing the breakout level while staying above key moving averages, reinforcing bullish sentiment.
- Moving averages (e.g., 50 EMA, 100 EMA, 200 EMA) are in an upward slope, acting as dynamic support.

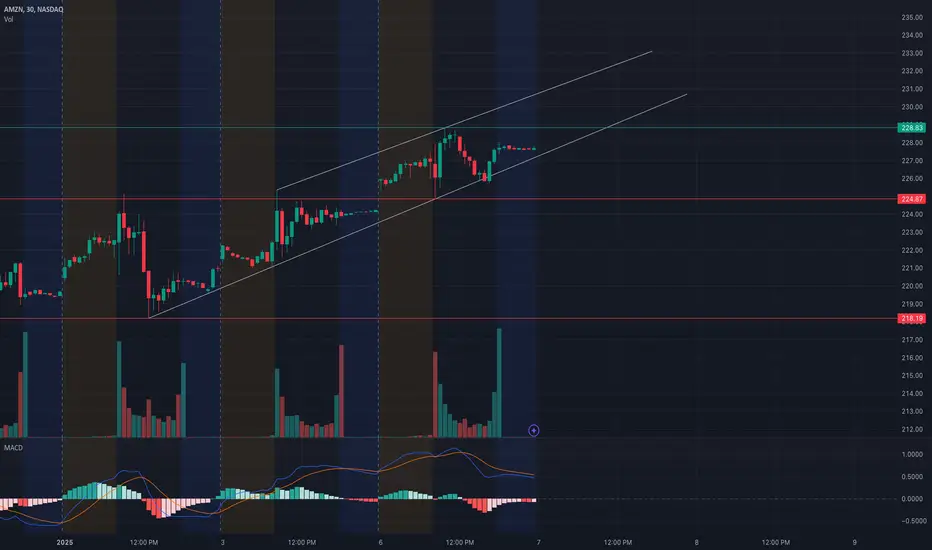
AMZN Holding a Rising Channel! Will Momentum Push It Higher?
30-Minute Timeframe Analysis
* Trend Overview: AMZN continues to trade in a rising channel with consistent higher highs and higher lows. The price is currently near $228.83, a key resistance level. The possibility of a market gap up or down at the open may change this structure significantly, requiring traders to reassess and adapt their plans accordingly.
* Key Levels:
* Support: $224.87 and $218.19 are critical areas for buyers to step in if the market gaps down.
* Resistance: $228.83 and $233.65 are immediate levels to break if bullish momentum continues or a gap up occurs.
* Indicators:
* MACD: Slightly bullish but losing momentum, signaling possible consolidation unless a gap up re-establishes strength.
* Volume: A surge in volume aligns with recent upward movement, but follow-through is needed for a sustained breakout.
1-Hour GEX (Gamma Exposure) Insights
* Key Gamma Levels:
* Positive GEX: $230 and $235 are strong call resistance levels, with $230 as the highest positive gamma wall. A gap up could lead to rapid tests of these zones.
* Negative GEX: $217.50 and $215 are key put support areas, providing protection in case of a gap down.
* Options Metrics:
* IVR: Moderate at 56.1, indicating favorable conditions for directional trades.
* Calls vs. Puts: Calls dominate at 1.8%, signaling cautious optimism among market participants.
* Actionable Gamma Zones:
* Bullish Scenario: A sustained move above $228.83 or a gap up could lead to a gamma squeeze toward $233.65 or higher.
* Bearish Scenario: A gap down below $224.87 may activate put support and drive the price toward $218.
Trade Scenarios
* Bullish Setup:
* Entry: Break and hold above $228.83, or after a gap up that sustains above $230.
* Target: $233.65 and $235.00.
* Stop-Loss: Below $226.00.
* Bearish Setup:
* Entry: Breakdown below $224.87, or after a gap down that fails to reclaim $225.
* Target: $218.19 and $215.00.
* Stop-Loss: Above $227.00.
Important Note for Traders
* Market gaps at the open can shift the outlook significantly. Reassess support and resistance levels during the pre-market session and adapt your strategy to align with the updated price action.
* If you need technical analysis for AMZN or any other stock, feel free to contact me for tailored insights and detailed analysis.
Disclaimer: This analysis is for educational purposes only and does not constitute financial advice. Please conduct your research and trade responsibly