#BA straddle! Notional value - 2.8M$.Based on our team's research of the options market, we expect buy activity at the support level.
1BA trade ideas

bear call spread on BAThis will mark my 3rd spread in a row on BA.
The 200 sma on a weekly, 100 sma on a monthly are acting as resistance.
+5 up days in a row. Expecting some light selling maybe? Or sideways action.
If we do drop - I'll get into a bull put spread at some point! Hoping for an iron condor! :-)

Is BA- Boeing Company ready for bullish continuation ?BA is in the industrial sector. Presently a sector may be underway with the industrial sector
(XLI) getting more attention and some upticks. On the daily chart BA is seen in consolidation
at the high volatility high volume area about the POC line of the volume profile. In 2022,
BA descended from its post-COVID highs into a double bottom of the "W" type. Since then
the uptrend continued into the present consolidation. The zero-lag MACD shows the K /D lines
crossing the zero horizontal line. BA is further supported by the long term mean of the anchored
VWAP.
Given the pattern and trends on the highly reliable daily chart. I see this as a good setup for a
long swing trade of either stocks or call options with about 40% upside to the supply zone. I
see it as a good way to diversify away from technology for better risk management.

$BA Breaking Out or Double / Triple Topping?Boeing – This has been a frustrating name for me. It broke out in January, of which I caught some. But it has been in a range, a wide range for 6 months. I took advantage of the bad news on Tuesday, Jun 6 when it dipped and bought a starter at $202 (sometimes its better to be lucky) and added again today as it breaks above an area of resistance. However, it has entered Double / Triple Top Territory so for new entries at this level the caution flag should be out. My average cost is $210.05 and that is where I have my stop. This could be one for your watchlist because of both the breakout and high volume today, already near its 10-day average.
I hope this helps someone. These are my ideas and are not meant as investment or trading advice.
Thanks for looking. Constructive comments always welcome.

$BA Long Could see a nice rally here, breaking out of the range. We had a huge failed breakdown 2 days ago with that wick.

Triangle BreakoutThe stock is trading in what seems to be a triangle. A breakout for a long position will do.
Symmetrical Triangle Neutral until broken.
Top line sloping down indicating lower highs.
No recommendation.
52 week range
113.02
221.33
Day Range
200.61
211.68
EPS (FWD)
-1.84
PE
-
Div Rate (TTM)
-
Yield (TTM)
-
Short Interest
1.38%
Market Cap
$128.33B
Volume
10,940,804

BA Boeing Flying Above Ichimoku Clouds. Hara-Kiri for the bears I've been invested in this from $130 it is 10% of my total investing and trading capital. The bad news is over for Boeing the stock is still trading cheap compared to the growth this company will have as the US - China Arms and Space Race heats up. Plus the future growth of the aerospace and defense industries in general. Target is for BA to test it's all time high of around $400 .

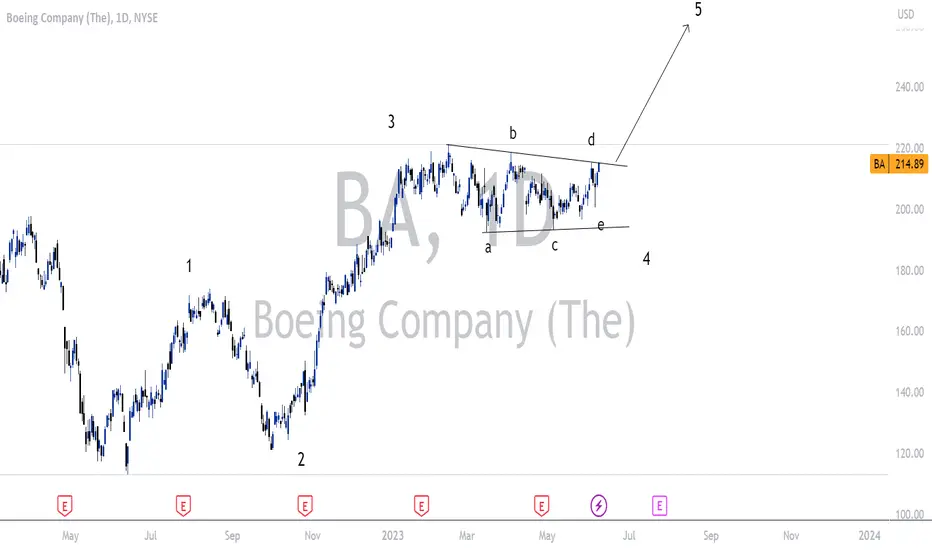
Boeing CompanyHello, dear friends
In the Boeing stock, we see a clear 5-wave pattern
This pattern is now in its 4th wave
And this wave with a high probability is a triangle that always appears in wave 4
Therefore, we expect the completion of wave 4 and then the share growth in wave 5
Good luck
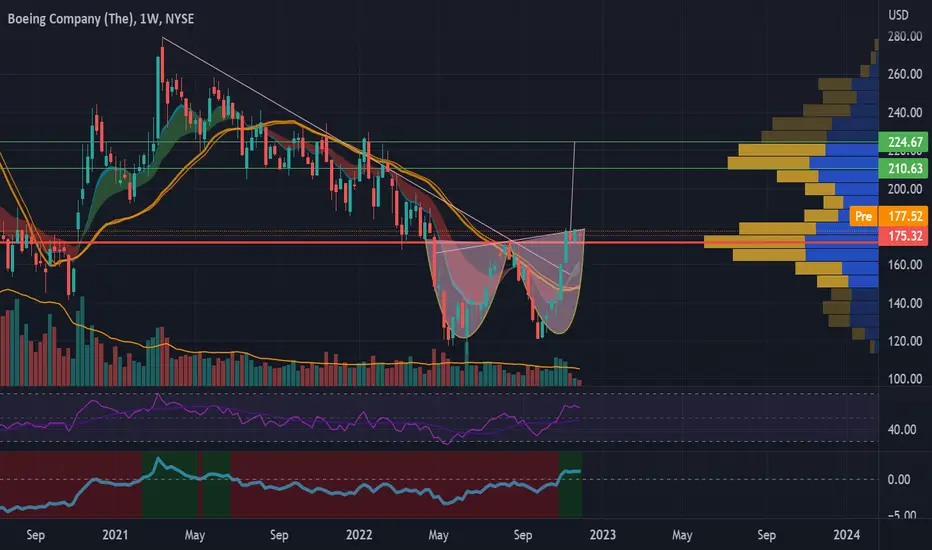
BoeingSince Feb 2020 Boeing has been stuck beneath its weekly 200sma.
Since the double bottom from October low Boeing has been consolidating along with the Dow, that consolidation has formed a flag or Handle for a double bottom continuation. If Boeing does breakout I have a target of 267 but first a 225 test. Alot will depend on if the dow can breakout (See link).
Long over 216
Stop loss 213.
Here's how the pennant or flag looks on the daily
Candle outside Daily bbands so we may pullback first.

Boeing- WWIIIBoeing...
The question I have for you is:
If we are heading into an A.I. driven technological explosion, why would a company like Boeing, who most retail investors know for building planes and engines be set for a meteoric explosion in stock price over the next decade?
One word: WAR
The catalyst for this potential world war? Control over a temporarily shifting and collapsing society
How does Boeing benefit? They have been benefiting from War since their inception..this will be no different
(GE will benefit from this potential war as well)

BA - boeing short - roll over. Boeing looks like it wants to roll over here.
It has been relatively choppy and could take a while, but there is a clear invalidation which makes me like the trade.
There are also many clear TPs so it is a short I'm willing to take.
It looks heavy.

Boeing looks bullish if boeing can break outta the falling wedge i think a move to $220 is a highly likely

$BA with a bearish outlook following its earnings #StocksThe PEAD projected a bearish outlook for NYSE:BA after a positive over reaction following its earnings release placing the stock in drift B with an expected accuracy of 66.67%.

Rectangle/Another Crisis? Price is bound between 2 horizontal trend lines.
The top is resistance and the bottom is support. Neutral pattern until broken.
T1 for a break to the upside is in larger green type then T2 in smaller green type and so on. Many would look to T2 only if T1 is passed.
Orange type are targets to the downside if support is broken with a confirmed trend in that direction.
News event: Boeing 737 deliveries are partially halted after new issue was found.
Earnings 4-26 AMC
No Recommendation.

Resistance at 220Since we made it up into the range between $200-$220 we started to see price experience significant resistance to being able to break beyond this level. Right at the start of the year after a long rally near the back half of last year we have seen completely sideways markets. With the last few month starting its trend downwards we can potentially see some retracement of the rally that we saw at the end of last year. Since breaking below the most recent trend level, looking to see if price continues on the current bearish momentum.

BA - Boeing HarmonicGood Day
Mentorship with @candleboxlaw
Harmoinic with Eulers law
all credit goes to SHA256_Lock_Smith

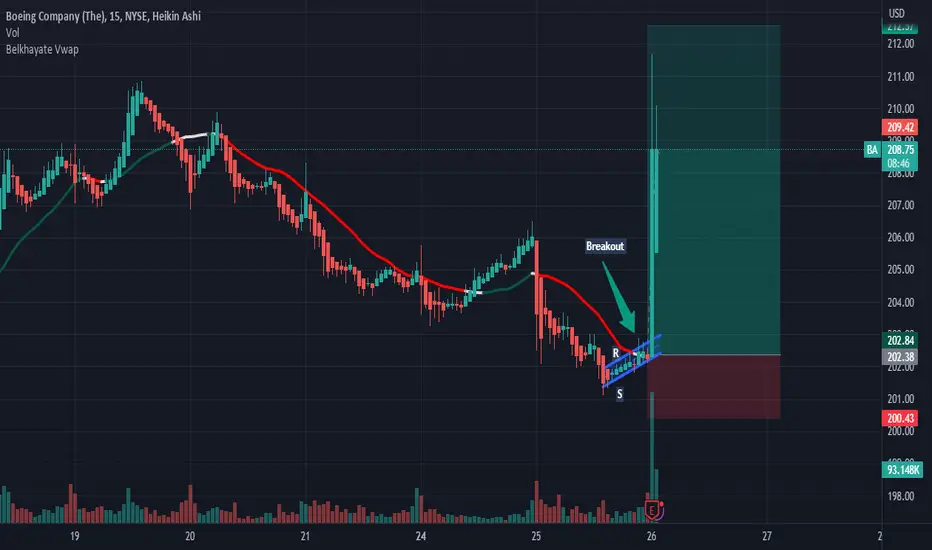
BA: Buy ideaOn BA as you see on the chart we have a buy idea because we have the breakout with force the vwap and the resistance line by a big green candle.Thanks!
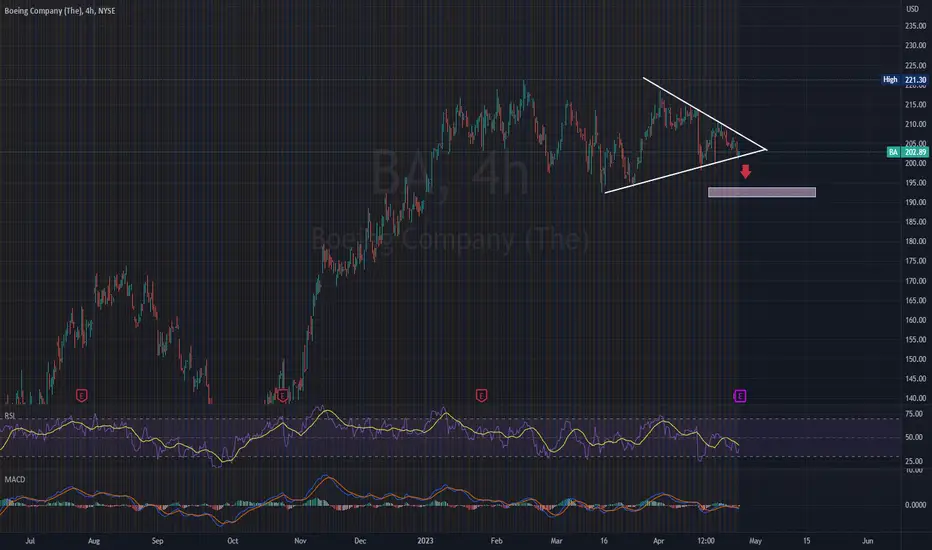
BA - BEARISH SCENARIOBoeing Co. is heading for a slight price correction before the Q1 earnings report. The company is expected to report satisfying results. The price target is located at the $ 190 resistance level.
Risk Disclosure: Trading Foreign Exchange (Forex) and Contracts of Difference (CFD's) carries a high level of risk. By registering and signing up, any client affirms their understanding of their own personal accountability for all transactions performed within their account and recognizes the risks associated with trading on such markets and on such sites. Furthermore, one understands that the company carries zero influence over transactions, markets, and trading signals, therefore, cannot be held liable nor guarantee any profits or losses.
BAThis should get moving pretty good once it breaks out of this range. Gut says down but we'll see. Earnings next Wednesday.

BA rising wedge creatingBA creating Rising Wedge . May BA will fill the gap and get target 215-218$ before free falling . Will focus if BA break down below rising wedge

BA Gap Fill SetupBA 65m: Acute analysis potential gap fill to upside contingent on auction acceptance. Positive ER from UAL, expanded partnership with Invictus Games this morning, and ER next week catalysts for participants// 215.55 is a KL to be watched as it is where auction failure has occurred five times YTD// KLs 206.80, 208.77, 208.94, 210.13, 211.50, 212.56, 215.55// Beta 1.43, ATR 5.72, IV: 34.09%// Price at time of publish: 210.65
