1BA trade ideas

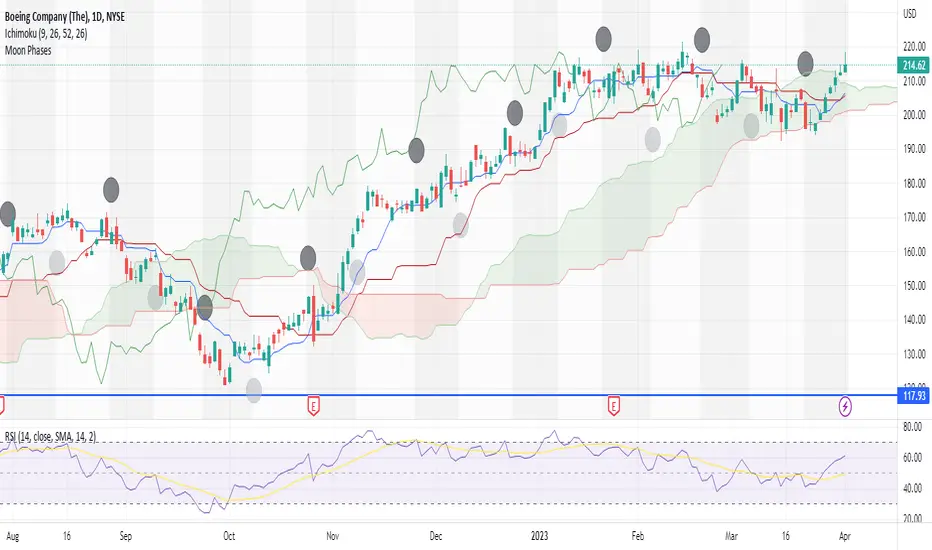
BA is a BUY +++++Boeing broke it's down trend a couple months ago and has been consolidating, it's held cloud support, recently broke above the cloud and the MA is crossing over making this a buy! New moon printing tomorrow or Wednesday suggests favoring a bullish trend
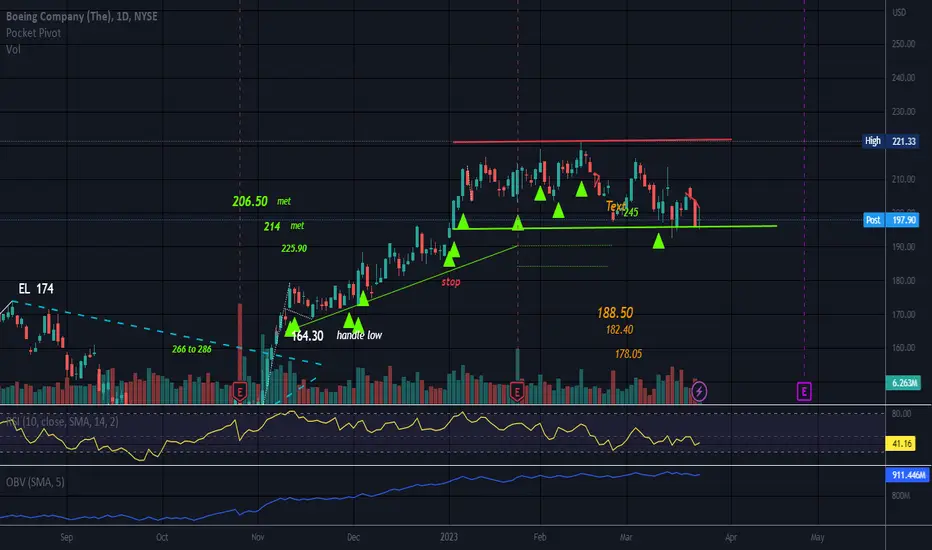
$BA Continuation Head and Shoulders SetupI have no appetite for any buys right now with the chop fest action that's been going on for 2 weeks plus but here is NYSE:BA looking interesting with continuing head and shoulders pattern with a right right shoulder.
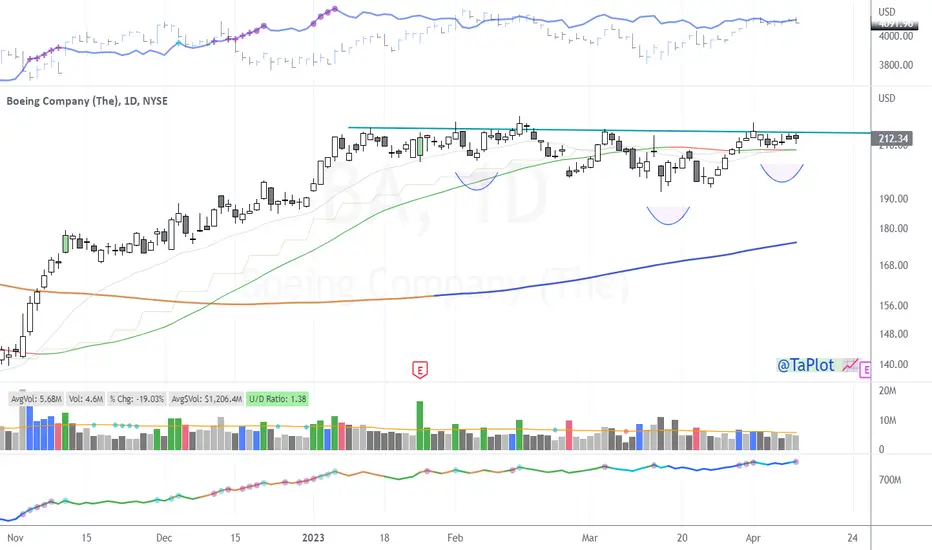

BA = UPHere is a pure price action analysis of BOEING consisting of support and resistance, trend line analysis and candle stick analysis on multiple time frames (1W-15m).

BA: Week of April 10And officially happy Easter everyone!
Surprise, surprise, probs on BA are bullish for next week. Pretty bullish.
We are in this peseudo pennant so we could see a re-test of 208/207. From there I would look for a bounce.
Unless this just decides to kick off the week with a breakout (which would be typical BA fashion, 0 to 100) and go right for the high targets.
Personally targeting 216.
Not advice!
Safe trades and enjoy the rest of your Easter weekend :-).

BoeingClosed gap at 218 yesterday and closed back below fib resistance at 215..
Got a sell rating today after 8 straight days up lol. Crooks.
Should pullback to retest 207.. from there we either bounce or head back to 195


BA: Updated thoughts Weekly updated thoughts on BA.
Not advice! BA is an incredibly hard stock to trade.
Let me know your questions below.

BoeingShould pullback to 200 here..
Volume dropped by 40% after hitting downtrend resistance here
209 stop loss

BA: UpdateTrying to do more stock analysis in under 4 minute videos to share my immediate thoughts on stuff :-). Let me know if this is something you like and would like to see more of.
These are my updated thoughts on BA. As of right now, no recommendation.
Safe trades everyone!

Boeing about to take a dive. BABearish Gartley 222 on Boeing. I especially like the fact that there is a high degree of symmetry on the horizontal access, and the pivots at 0.886 level Carney talked about in his Harmonic trading material.
We are not in the business of getting every prediction right, no one ever does and that is not the aim of the game. The Fibonacci targets are highlighted in purple with invalidation in red. Confirmation level, where relevant, is a pink dotted, finite line. Fibonacci goals, it is prudent to suggest, are nothing more than mere fractally evident and therefore statistically likely levels that the market will go to. Having said that, the market will always do what it wants and always has a mind of its own. Therefore, none of this is financial advice, so do your own research and rely only on your own analysis. Trading is a true one man sport. Good luck out there and stay safe.

BA thoughts So, if you follow me on my other post, my weekly puts I sold on BA expired worthless, thankfully.
Nice to be on the opposite end of a horrendous option trade for a change :p.
I did a restrike at 190 for next week put sell, just 2 of them on the bounce off the 194 support.
Probabilities are very bullish on BA for next week. But aside from the probs and the math, the chart is pretty clear imo.
If you look at it, it is forming a pennant type structure. Slowly but surely we should be making our way back up towards 202.
Probabilities for the high targets are 3:4. For the low targets its 1:4.
I have been very risk averse lately with the whipsawing market, but I am going to swing this long next week depending on where we open. BA kind of ruined my last trade I had planned by gapping up at my TP (see my previous post), so if gaps up towards 200, I will just stick with the puts I sold. Otherwise, I am going to be looking to long this towards the top of that flag structure.
We will see the open targets and 99% targets at open on Monday and I will post them here.
Safe trades everyone!

Weekly double bottom on BABA has tested its 200 ema and consolidated on that level prior to falling back to confirm the double bottom formation. The coming months for BA are going to be interesting. An overall price target for BA will be in the 275-278 area. I can see this catapulting past that with a minor retracement. These levels haven't been seen since Mar 2021. I am bullish on BA in the coming months, with a short-term bearish retest of the weekly 50 ema 183.86. The formation is invalidated below the yellow line

BA 190/170 May put vertical spreadTrade thesis
- technical breakout (bearish)
- downward break out of 3 months consolidation zone
- weekly stochastic showing more room to downside
- entry trigger: retest of demand zone and failure to hold above (wicked into the zone and closed below on daily)
Position
- strategy: put vertical
- structure:
long 05/19 190p
short 05/19 170p
- cost: $450
- delta: -19.68
- theta: -2.311
- gamma: 0.54
- vega: 10.15
Targets
- 1st target: $190.50 zone (previous gap fill)
- 2nd target: $173-169 zone
HVN from post covid to present
confluence of .5 retracement level from previous low to recent high
- SL target
technical: weekly close back into consolidation zone
discretionary: price action at key price levels
discretionary: price action when stochastic enters oversold level (below 20)


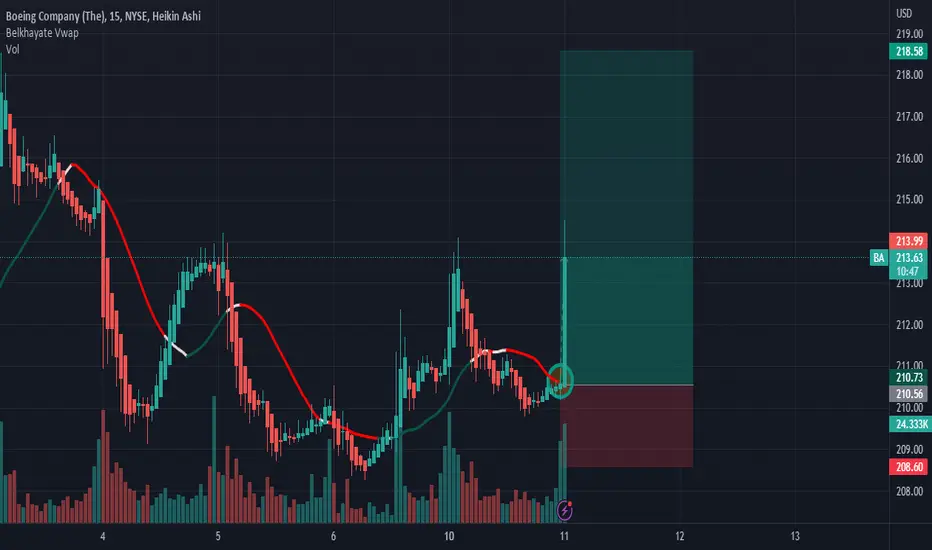
BA: Thoughts Looking to potentially day trade this back to 210.
Tomorrow I am expecting the SPY and Q crowd to be range bound and choppy, so looking to hang with the more sophisticated BA and Dow crowd ;).
If we can see this support maintained at 202, I am looking to trade this to the green box.
Going into Wednesday, if the feds come in hot, I do expect BA to feel the initial shock wave and arrive down in that red box. I do not expect it to last long though. Out of all of the stocks that will feel the jolt of a hot and heavy fed, I believe BA will likely be the first to rebound aggressively, just judging by the sheer volume of dip buying it has seen lately and how unphased it has been by all of the selling elsewhere.
But make no mistake, BA is not immune to panic selling and I fully anticipate panic selling to happen with it (if FOMC results are unfavorable to market conditions), which is why I would advise not swinging this for the time being. Look to day trade it tomorrow as it will likely be a bit more stable than the other stocks, or wait for the FOMC reaction and make your move.
My thoughts, not advice!
Safe trades everyone!

Boeing: Aerobatics ✈️Welcome to Boeing’s aerobatics-show! Watch with bated breath as the share is taking off from the magenta-colored zone, propelling toward the resistance at $224.76, which it should conquer soon to conclude the loop of wave 1 in green in the green zone between $251.82 and $288.54. Then, in a death-defying stunt, Boeing should drop back below $224.76 and dive below the support at $173.85 afterward. However, there is a 33% chance that Boeing could curb its boost earlier, slipping below $173.85 prematurely to develop wave alt.2 in green into the green zone between $168.58 and $141.08. In that case, wave alt.1 in green would have already been finished in January.

Boing, were to go from here?It’s looks going at least 50% fibo from here, but 88 fibo more attracting to me at this stage,
Lets see how it goes

BOEING COMPANY short bearish push for expect
Hi viewers, BA price break zone, tech. side showing we can expect bearish trend
TP1:192
TP2:186
TP3:180
