THE BOIENGthis can be accumulated for short term trade for next 2 months, as airlines doing well in and will out perform others due to holidays
1BA trade ideas

BA daily evening star reversal with RSI divergenceSell Stop 127.27 LMT 127.27 GTC
Buy Limit 115.27 GTC
Buy Stop 137.06 GTC
BA daily evening star reversal with RSI divergence wave 5 of downtrend

BA BEARBA rising wedge correctional pull-back retesting support. Looking for a move back to 121. Short sweet and simple.

BAThis setup reminds me a lot of AMD last week. Was trying to break through an inverted h&s at $69 but couldn't do it. That night I think they released a warning about earnings and the stock was down >10% the next day. I'm in puts in case BA pulls something similar tonight or this week.

Boeing Company pushed back from support. Up!Ticker: BA
Idea: Long
Horizon: 1-2 months
Target: $170
Potential of the idea: 28.59%
Entry volume: 5%
Stop order: $109
Technical analysis
The testing of the support level of $120 was successful, and the price is consolidating above this level. With the volume of the position at 5% and stop order placement at $109, the risk on the portfolio will be 0.88%. The profit/risk ratio is 1.63.
Fundamental factor
The Boeing Company is the world's leading aerospace corporation and the largest manufacturer of passenger planes. The company's report, which will be published on October 26, may pleasantly surprise the market. If forecasts are confirmed, Boeing may show profit in III quarter, which will lead to growth of quotations.

BA daily indecision inside candle pressure buildingOrder BUY BA NYSE Stop 134.10 LMT 134.10 will be automatically canceled at 20230401 01:00:00 EST
BA daily indecision inside candle pressure building ABC of wave 4 downtrend. Stop loss under two candles, take profit to Fibonacci 50% retracement.

Buy #Boeing #BA broke 132 resistance level on daily chart 📈
The short term is up
Stop loss 121 level

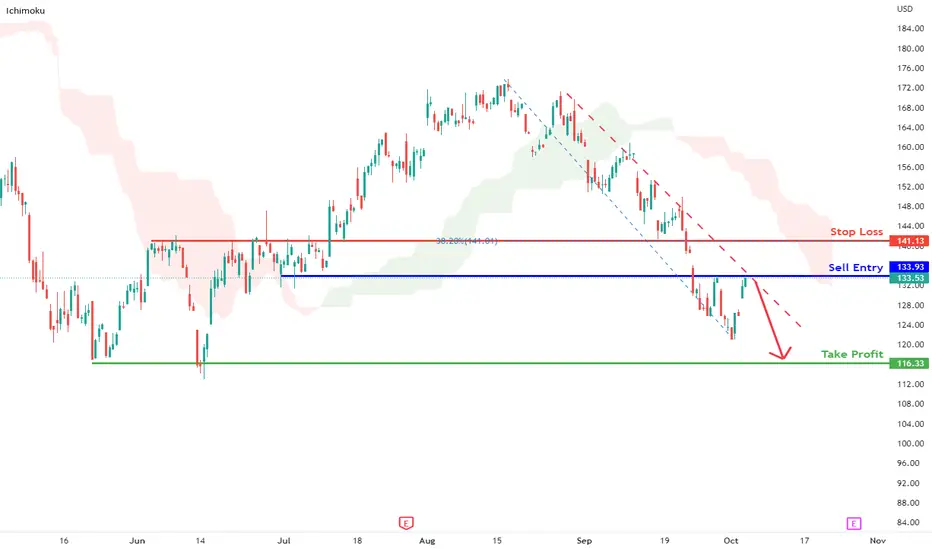
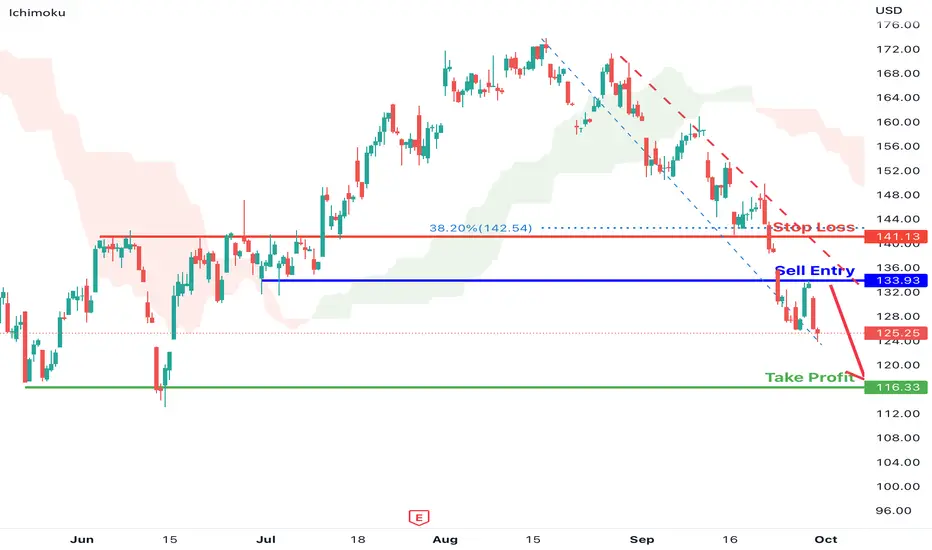
BA Potential for Bearish Momentum | 5th Oct 2022On H4, with the price moving below the ichimoku cloud and descending trendline, we have a bearish bias that the price may drop form the sell entry at 133.93, which is in line with the overlap resistance to the take profit at 116.33, where the swing low is. Alternatively the price may rise to the stop loss at 141.13, where the 38.2% fibonacci retracement is.
Any opinions, news, research, analyses, prices, other information, or links to third-party sites contained on this website are provided on an "as-is" basis, as general market commentary, and do not constitute investment advice. The market commentary has not been prepared in accordance with legal requirements designed to promote the independence of investment research, and it is therefore not subject to any prohibition on dealing ahead of dissemination. Although this commentary is not produced by an independent source, FXCM takes all sufficient steps to eliminate or prevent any conflicts of interest arising out of the production and dissemination of this communication. The employees of FXCM commit to acting in the clients' best interests and represent their views without misleading, deceiving, or otherwise impairing the clients' ability to make informed investment decisions. For more information about the FXCM's internal organizational and administrative arrangements for the prevention of conflicts, please refer to the Firms' Managing Conflicts Policy. Please ensure that you read and understand our Full Disclaimer and Liability provision concerning the foregoing Information, which can be accessed on the website.
BA Put. Closing below $129.93BA looks like it has some more downside. It's looks like it will close under $129.93(support)
If this closing under $129.93 on the daily, we will see some downside to $123.38, if it closes below that it will go to $112.79
ENTRY: $130-$128.80
1st Target: 123.38
2nd Target: 112.79
Please wait for confirmation(closes below $129.93 on the daily)
Always have a S.L if you don't watch the charts during the day.
I may come back to update this idea later today.
Be blessed and prosperous this week. Don't fight the trend.

BA Potential for Bearish Continuation| 30th Sept 2022On H4, with the price moving below the ichimoku cloud and descending trendline, we have a bearish bias that the price may drop from the sell entry at 133.93, which is in line with the overlap resistance to the take profit at 116.33, where the swing lows are. Alternatively, the price may rise to the stop loss at 141.13, where the 38.2% fibonacci retracement is.
Any opinions, news, research, analyses, prices, other information, or links to third-party sites contained on this website are provided on an "as-is" basis, as general market commentary, and do not constitute investment advice. The market commentary has not been prepared in accordance with legal requirements designed to promote the independence of investment research, and it is therefore not subject to any prohibition on dealing ahead of dissemination. Although this commentary is not produced by an independent source, FXCM takes all sufficient steps to eliminate or prevent any conflicts of interest arising out of the production and dissemination of this communication. The employees of FXCM commit to acting in the clients' best interests and represent their views without misleading, deceiving, or otherwise impairing the clients' ability to make informed investment decisions. For more information about the FXCM's internal organizational and administrative arrangements for the prevention of conflicts, please refer to the Firms' Managing Conflicts Policy. Please ensure that you read and understand our Full Disclaimer and Liability provision concerning the foregoing Information, which can be accessed on the website.
BAJust speculating. Looking for how the price can possibly bounce and was looking at this comp for a while now.

BA: Prognosis and Outlook I haven't traded BA since my previous idea, but I have been watching it sort of. It has been selling off with the rest of the market and thought I would update as to where I see it going.
I will cover both short (next week) and long term. I am watching BA very closely because, if you didn't know, I like the stock. I am an ex-Boeing investor and am anxious to re-invest and just write covered calls on this company. But I do have a target price for when I will begin re-investing and I will cover all of that in this post.
Brief Recap
So as I said, BA has been tanking with the rest of the market. I have been avoiding BA for the time being because my prob models on it were quite positive actually and had very optimistic projections, but in the larger context of the market it really didn't stand a chance. Alas, here we are.
But basically, BA has been traveling in a descending channel. It hasn't really been doing anything overly interesting, just sort of making its way down this channel. I suspect it to continue and where things get interesting is there is a key support line that BA is approaching (see chart below):
This support line essentially extends from the COVID crash, we made 1 test of it on the initial sell down and BA is on its way back towards it. Support from this line is around the 110s (114 ish).
BA is currently resting at the bottom of its descending channel and it is fast approaching this major support line.
As well, BA has fallen out of its monthly trading range and surpassed all 3 monthly bear targets.
BA Outlook
BA is a really disastrous stock. It is actually one of the worst stocks I have seen. It has quite an erratic growth line. I have shown this before, but here is a current snapshot of BA's time series chart:
BA had this random parabolic run between 2018 and 2020 and then never quite recovered post pandemic. Why? I am not sure actually, but I suspect it has something to do with BA's fundamentals. It is a fundamentally flawed company unfortunately, and I think if it wasn't for the fact that it essentially holds a duopoly and many government contracts it would have gone bankrupt ages ago. Mind you, EADSY (Airbus) has a similar looking chart (as does ITA) so it may just be aerospace specific.
But ultimately its neither here nor there. All we care about is where is BA headed? Short term, I think BA is in for a bounce and long term, BA has a bit of a ways to fall. So let's get into the numbers.
Next Week
So because BA is at the bottom of its descending channel, it is oversold, etc. etc. BA very well may get a reflexive bounce here. However, I think the market is still heading down a little sooner than maybe most people think so I actually wouldn't personally play a bounce here (maybe as a day trade but there are better stocks to day trade for a bounce), but I will give you the mathmatical bull and bear targets for BA next week:
Bull Targets:
1. 131.86
2. 137.56
3. 143.26
Bear Targets:
1. 126.53
2. 120.47
3. 114.41
Which are likely?
Well, I do find it interesting that the 3rd bear target is actually around where that support line is. So that is something to keep in mind and also one of the biggest reasons I am not over-zealous here about a possible bounce.
That said, I do forsee some upside going into the beginning of the week, I just suspect it to be short lived and I really don't foresee BA surpassing its 2nd bull target, if its lucky enough to get there.
My mid term target here is the 114.
Where is BA going?
Its really hard to say because it is such a disaster stock. I have time series modelled BA but its quite challenging for BA because BA has historically traded so poorly and erratically. But essentially, running time series based on the chart I showed you above, we get a projected range for the next month of $96 - 146.
This actually corresponds to my initial thinking some months ago when I suspected BA was heading for the double digits. It never quite got there, but I figured it, along with SPY, would make another running attempt at attaining those double digits. And time series seems to agree with me here this time.
My personal target:
My personal target on BA is in the double digits ($96). I suspect us to see that $96. Potentially lower, but BA going very much lower than that would be pushing it into massive negative growth and would signal that the company is truly fundamentally flawed. But this would not surprise me because like I said, BA is a fundamentally flawed company. I still stan them though.
96 is where I would begin to re-scale into my longer term BA position (As an investment not a trade). I would scale if the stock continued to drop, but it wouldn't concern me as much as the plan is to write calls.
Summary:
So, in a nutshell here is the takeway:
- Overall bearish bias here; save for a reflexive bounce that is likely. For fellow day traders, I would be looking for that on Monday. For Swing traders, I would be looking to potentially open a short position next week after a minor bounce.
- Mid term target is 114.
- Long term target is 96, potentially lower.

BA Shortin Down trend Channel
Gap open in Supply Zone
Earning: 7/27/2022 Est. -0.13
Short 150
Stop 160
Target 115
Risk management is much more important than a good entry point.
I am not a PRO trader.
In my trading plan, the Max Risk of each short term trade should be less than 1% of an account.

$BA - Target 120Looks like a clean short. Most stocks are forming convincing bearish set ups. I expect some serious selling this week across all sectors.

BA looking for 125?BA looking good for coming days . as you can see the wave 1 and 2 has been played out , the initial target is 125 for wave 3 or wave c . once at that level we can determine if its wave c or wave 3 therefore can determine better direction at that time . will be posting update soon

BA - Best Short Of The LotMade a few threads on BA in this area now....
Obviously some risk of looking foolish saying something to be "best" before the event, but BA has been a real treat so far.
Incredibly limp to the upside and now while SPX is rallying it has nothing but weak corrective PA and tidily pushing up against the 50MA to print a very small gravestone doji shakeout reversal pattern.
The question remains though, will this fall like a rock on the next index leg down, assuming it comes.
My guess is obviously yes, very steep downside should be on the way - the effect to realise this long corrective cause.
Not advice.

BAGrabbed a small-ish put position today. Weekly close below the yellow supply zone is confirmation for heading lower imo.

QuickTrade n. 43 : BALooking for a cross or a rejection on the 250h.
Price action is extremely bearish.

Boeing Company continues to grow and no trend change is expectedHorizon: 1 month
Target: $190
Potential of the idea: 20.41%
Entry volume: 10%
Stop order: $148
Technical analysis
The upward trend continues, the entry on the correction is relevant. With the volume of the position of 10% and placing a stop order at $148, the risk on the portfolio will be 0.62%. The profit/risk ratio is 3.29.
Fundamental factor
The Boeing Company is the world's leading aerospace corporation and the largest manufacturer of passenger aircraft. Q2 2022 reports showed that the company has been able to significantly reduce losses. Going forward, a return to profit generation could serve as a driver of the company's value growth.

BA: Interesting Week Ahead Hey everyone,
This long weekend is throwing me off. But gives me more time to do the analyses I want, including BA, QQQ and SPY.
Thought I would kick it off with BA because its looking pretty interesting!
So let's get into it.
Recap: BA started the week strong, made me a little nervous with my weekly swing target of 154 but then it quickly reversed and we ended up surpassing my target of 154. Trust the math, as they say ;).
So what about next week?
Let's break it down.
Volume:
Selling volume picked up on the 30th, with a loss of around 30% of buyers. Some buyers stepped in the following day, but it quickly lead to sell off with BA losing 25% of its buyers on Friday.
The average Buyer to Seller Ratio (14 day) over last week was 1.12. Still quite a bit of buying compared to the previous weeks average of 1.02.
Technicals and chart:
Boeing closed with 14 day Stochastic of 4.34, RSI of 30.34 and Z-Score of -2.00.
On the 1 hour it looks like BA could be going for a little double bottom. We have an overhead gap that is really reachable at 159. Directly above this gap we have overhead resistance. Here is the bigger picture of this overhead resistance:
The volume ratio and % change, taking into account the chart itself, lead me to think that we could actually see a bit of a bounce next week. What kind of is backing this is, in doing a probability assessment, BA is straddling in the middle of bullishness and bearishness. I find this very interesting and it leads me to believe that BA isn't quite ready to tank.
Also, when I calculate swing targets over the next 4 days, I get the following:
Bullish Target: 159
Bearish Target: 142
I find the bullish target extremely interesting because this also corresponds with the gap and is really close to that overhead resistance.
My opinion/ my hope and dream is to see BA bounce to fill that gap and then reject that overhead resistance. If BA comes up and rejects that overhead resistance, its a no brainer short. If it tanks from here, its completely possible and fine, its just a little messy.
Snap Shot in Tuesday Trading Day:
Based on the probability assessment, the technicals and the chart, I can see the trading day progressing something like this:
- Gap down (highest probability) where we see a price in the low 151 range.
- It is possible we see 149, but its more likely we stop around 151/150.
- From there, we likely could get a bounce and bring us to 152 - 153 range.
- I would suspect, if my hypothesis is correct, we could see BA continue to bounce a bit into the week before making another leg down.
Summary:
- Tuesday, look for a bounce off 151 (if this is broken, look for a bounce at 150) to bring us back up to 152 and 153.
- If BA is able to sustain this levels, we can assume that is will likely be gunning for a gap fill at 159, which should be your swing target.
- If BA is unable to bounce and it breaks below 149, then chances are we will be heading for the 142 calculated bearish target.
Just my thoughts!
Leave your comments/questions and critiques below.
Thanks for reading!


Boeing BA - A Dark HarbourI have never looked at Boeing until today, when I saw some guy posting ideas about it while I was having lunch and I didn't even recognize the ticker, and so I took a look at it, and was surprised to see what I found.
In considering this company, I completely understand that they've had problems with their planes, and big ones. But I have also said that I do not put much weight in the ostensible correlation between fundamentals of a company and price.
So long as the equity is still being maintained by Wall Street's behemoths, price action will remain orderly made and constitute a fractal that is rationally written and contains the combined intelligence of all market participants.
Boeing is really notable on the monthly charts:
Frankly, its bullish price action looked even better than what stuff like AAPL and TSLA printed during this unsustainable Federal Reserve money printer-backed tractor pull to SPX 4,800, and it occurred before COVID, and was accompanied by heavy distribution.
It only finally corrected when COVID hit, and yet it only swept out the '16 low, which led to the original impulse to $450.
Even more taste bud-piquing is the weekly chart:
BA has not had a shred of bullish impulse since March of 2021. More or less, while the entire market went ape-up in a straight line, Boeing has just grinded downwards.
This is highly indicative of significant smart money accumulation.
When the big 2022 correction started, Boeing lost 30% like everyone else, but formed a 24-month double bottom and protected its pre-COVID low with a generous wick and a healthy bounce.
More importantly, there is a gap that appears both on the daily and weekly candles at $330, which is exceptionally notable considering this mid-term range high, printed 18 months ago, wasn't far away at $~279.
I believe that a significant shakeout in the market will come shortly.
VIX - 9x8 = 72
But based on the price action of Boeing, I can't help but feel this is the definition of oversold and that an expectation from short sellers that this is going to turn around and rip south to new lows is going to be met with only one outcome: liquidation.
For other defense contractors like Lockheed Martin and Raytheon, although they have totally different (and much more bullish) price action compared BA, they share the characteristic of severely lagging the overall market in terms of bull impulse.
And these are arguably the most critical companies underpinning the United States and the globalist empire.
This leads me to believe that what lies ahead is a catalyst that will see defense and aerospace stocks go on a _significant_ bull run, providing an unlikely harbour amid an overall market that sees both equities and commodities revisiting (and breaking) pre-COVID market structure.
SPX / ES - Bull Whips and Bear Saws
For Boeing, it's still too expensive to buy, trading above the equilibrium point of this June-forward dealing range.
However, if this thesis that Boeing will go on a tear and not turn around and die is correct, I would want to see it fall to only a certain point and not flirt with the double bottom or the even the June gap lows.
The best buy signal, hands down, will be a dump into the $135 range, accompanied by market makers reverently supporting this area.
If so, you should definitely expect this whole 18 month range below $280 gets cleaned up, and likely in a highly aggressive fashion.
The question is, what serves as a catalyst for the defense and aerospace industry to moon?
There are no pleasant answers.
