1BIIB trade ideas

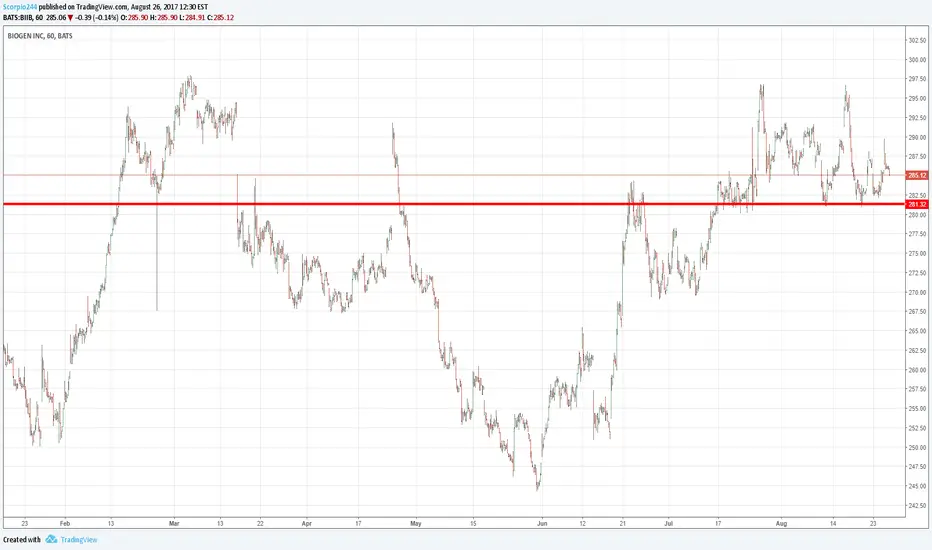
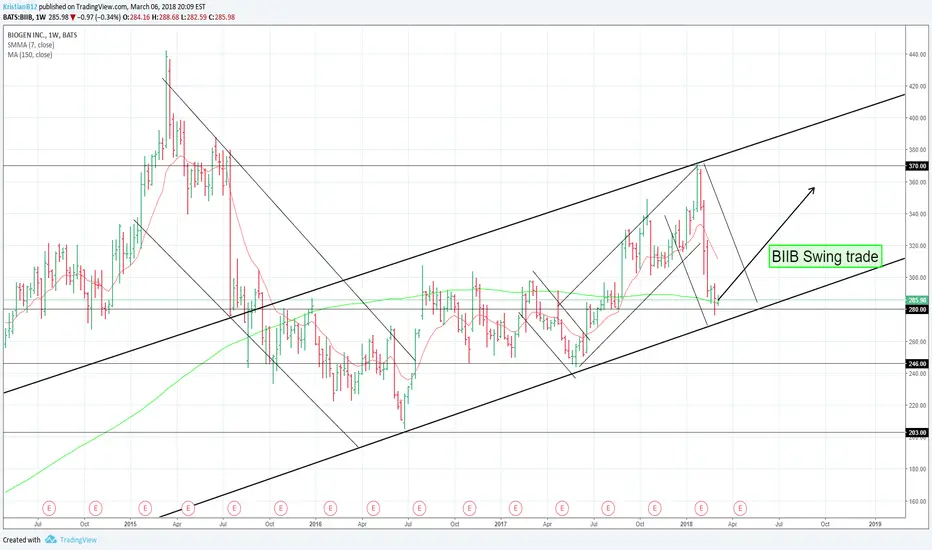
BIIB swing tradeGot it this morning at 284.95 a share... not the greatest entry, but I was busy and had to set a limit rather than watching the price live and making the decision, so not too bad.
Lemme know what you think, I didn't look at the fundamentals really at all here, just chart pattern. I've got a stop set at 281.50.
-Kristian


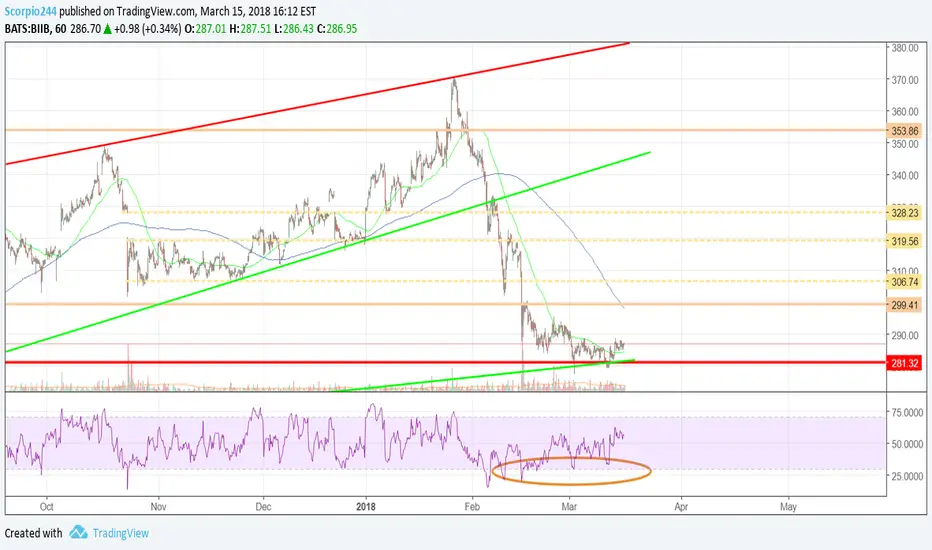
Biogen $BIIBBIIB reconociendo por 3ra vez el soporte dinamico ..
StopLoss : u$d 280
TP 1 : u$d 322
TP 2 : u$d 349

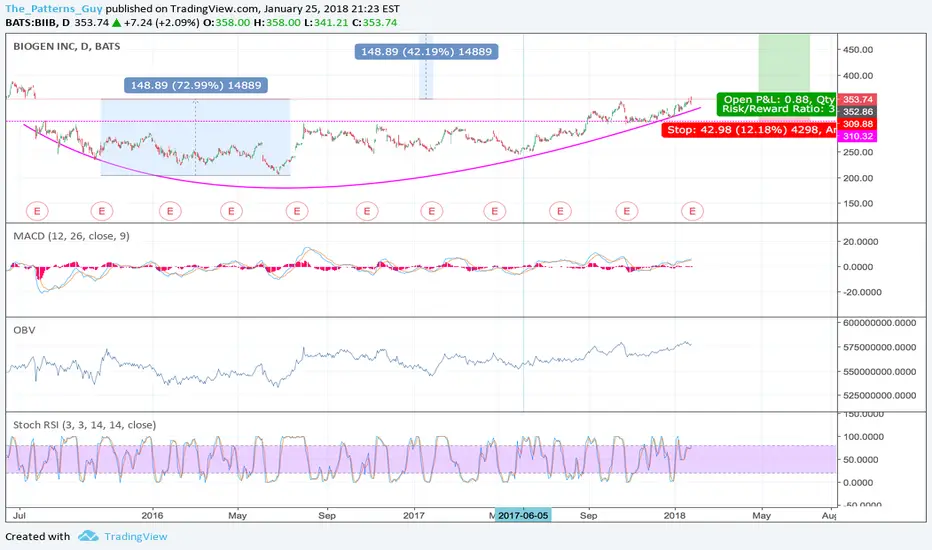
#BIIB #Long #stock #roundedbottomBIIB looks to be setting up a rounded bottom. I set a stop at the $310 mark because the is where it gapped down and made several failed attempts to recapture the up side. It finally did so with a powerful move at the end of august. I think this stock is going to get carried away with many of the other BIOTECH stocks. If you have looked at the XBI and the IBB recently you would have noticed the charts look good.
MACD poking up, OBV poking up, stoch RSI setting up for an up run. again series of higher highs and higher lows recently.
Weekly
MACD looking up, obv ok, stoch RSI ok, on the monthly the stock has started to make a series of higher highs and higher lows
BIIB - closing gapBIIB traded at a range with 300 level acting as resistance
price broke above 300 level and retested the area creating a bull flag
last days there are some hammer candlesticks on support with nice volume
could go much higher but short term i can see 350 area

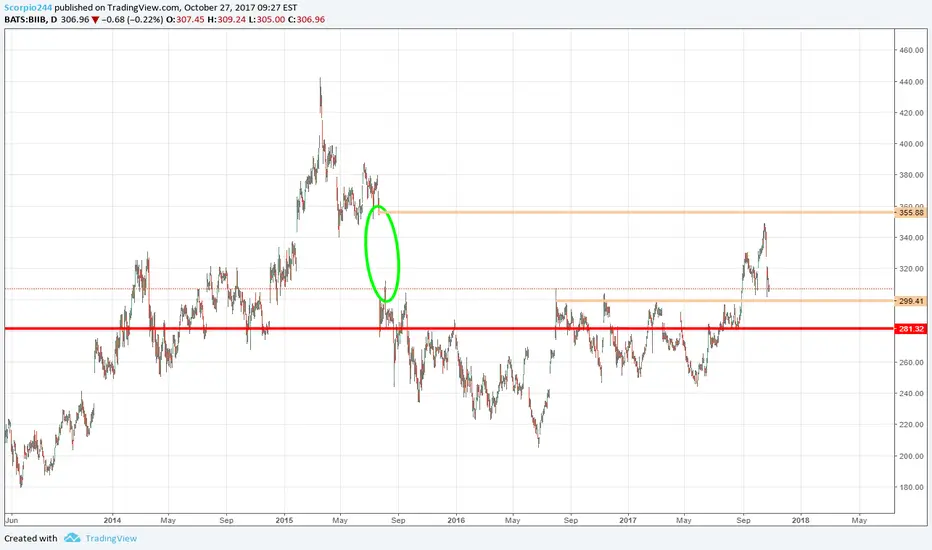
BIIB: What caught my attention was a $5M insider purchase of theStock. The huge consolidation that took place during wave 2 created a very strong support. When it broke out of wave 2, things look good. It looks like it would mount a challenge for the recent top of $350 but a failed 12-month test took the wind out of the sail. Looks like a contracting triangle will complete wave 4 correction. The next test results will be in 6 months.

BIIB: Beaten Down BioTech Sector: On the Cusp of a Huge Wave 3$9M shares bought by insider last Friday. Wave 3 Target of $403 matches Bull Flag Target.

BIIB: $5M of insider purchase of stocks today caught my attention. The chart looks great. Oscillators have lots of room to move up. Wave 4 correction appears cooked and a massive wave 5 can take it to $480.

BIIB: Falling Over 'Good' FundamentalsHuge biotech stocks are collectively getting hit in recent days.
BIIB has announced results on 24/10/17, beating top and bottom line expectations but stock still gap down and closed 3.9% down.
Prices fail to break above the top of the trendline measuring from Minute Wave ((a)) and reverse from the 100% fibonacci projection similarly from Minute Wave ((a)).
This is strong evidence of the relevancy of Minute Wave ((a)).
From a technical view, BIIB has seemingly completed a textbook A-B-C consolidation.
The recent high on 18/10/17 appears to be the final consolidation high.
Stock might attempt to retest this high $348.84 before continuing falling.
A successful re-test of this high will bring the stock down to its 24/06/17 low at $205.42.
A break above its recent high $348.84 will invalidate this analysis and imply a more complex consolidation on a larger scale.


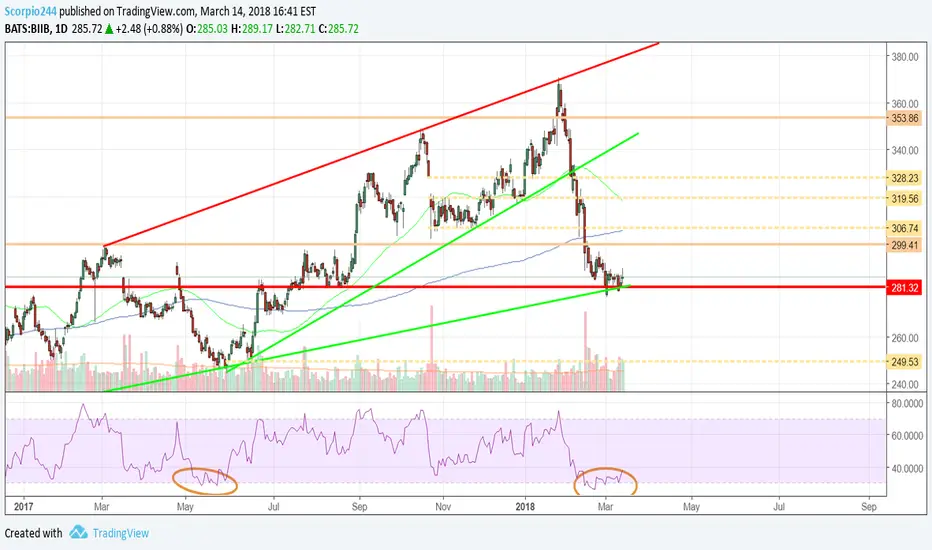
Buy the dip?50 day SMA in strong uptrend. Bullish RSI continuing to find support at 50. Hammer candlestick on Friday at bottom of channel/50 SMA on higher volume.

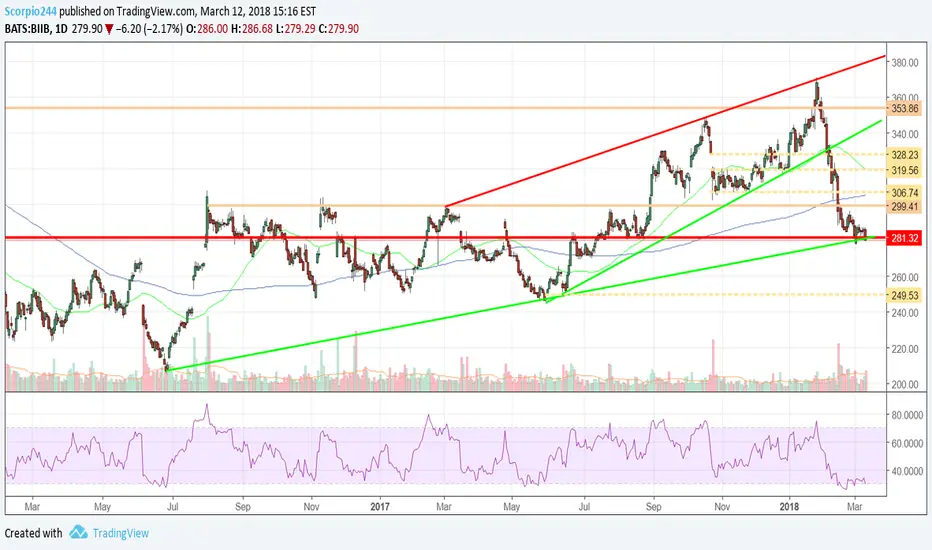
LONG BIIBBuy after confirmed breakout of second resistance and long for few months. Keep track for an exit strategy

BIIB: continuing trend after breakout?Biib could break over 324 USD, if not, it could go back to 296 befor it breaks out on higher level. I've started position on 307 USD (only 70 shares). Fundament looks good and news from Biotech sector could help it get higher.