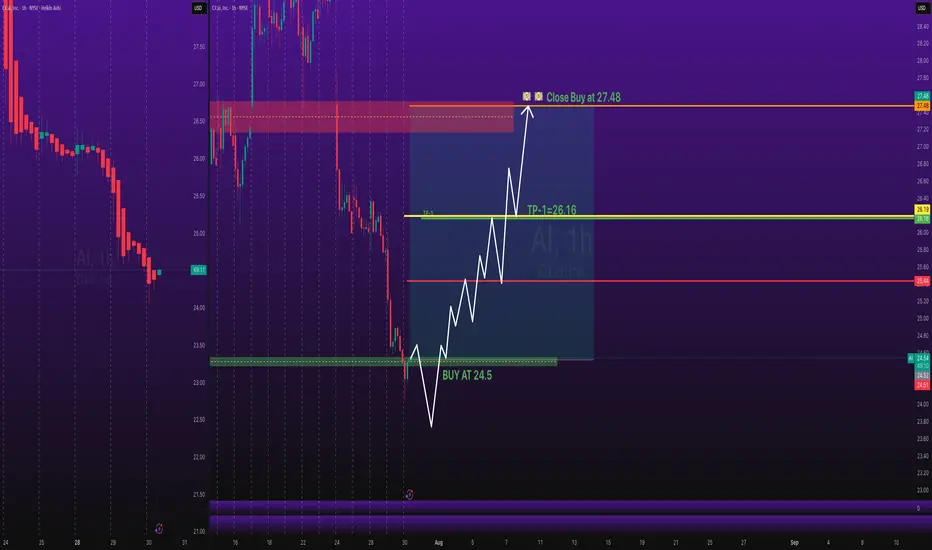
Stocks SPOT ACCOUNT: AI stocks BUT ENTRY with TAKE PROFITStocks SPOT ACCOUNT: NYSE:AI $c3.AI
stocks my buy trade with take profit.
This is my SPOT Accounts for Stocks Portfolio.
Trade shows my Buying and Take Profit Level.
Spot account doesn't need SL because its stocks buying account.
1C3 trade ideas
AI: Another accummulation swing round before a new journeyAI:
.
Another accummulation swing round before a new journey.
VCP pattern.
Less supply vol at the end of the accumultion range.
.
US STOCKS- WALL STREET DREAM- LET'S THE MARKET SPEAK
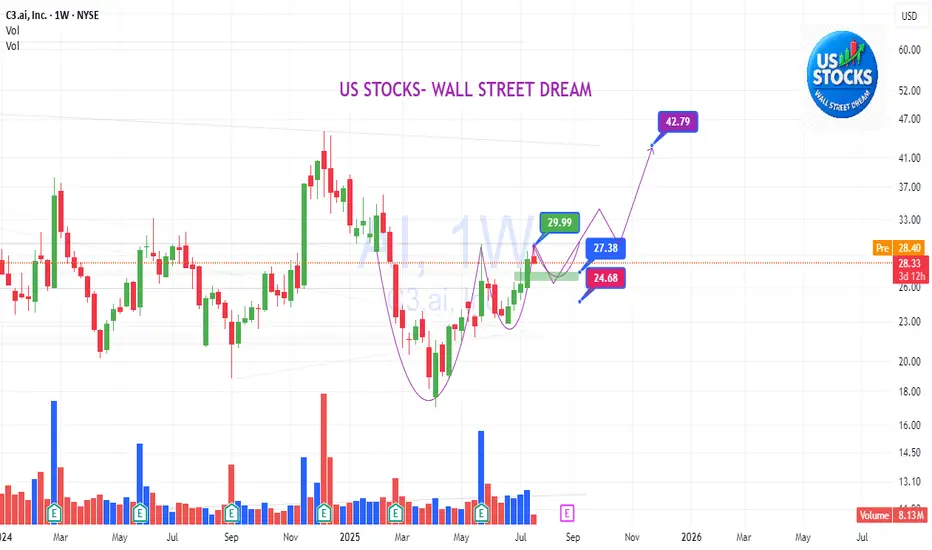
$AI they sleep, i eat. Quiet danger..Hello,
Name has been on my watch for a week or so now, finally just sitting back and getting to a multi analytical chart.
To begin: Yes, I see the head and shoulders pattern forming, scary, I know. Aside from that just zoom out, this name has traded in this range for 1,200 days... the range of $20 to $30 with some bumps in the $40's and low $20's with taps in the teens. This name is quiet, not a loud player like other AI tickers. Something smells fun here. I'm going to be gearing in some $40 calls for 2026. I may risk 20% of my port here. I feel confident in this one, I do. The name is holding good support in the low $20 range and there are a lot more green candles than red. I know other names are getting more attractive like BBAI, you still have SMCI, CRWV, NVDA and so forth, which is fine, means nothing. This was a meme name type of stock about a year ago. I believe this will go on a run towards $50. If you have patience, $50 calls for 2027 would be appropriate and at a fair price for a swing and a possible short squeeze. For those who want to play the shorter term volatility $40 calls for Jan. 2026.
Good luck.
WSL.

C3.ai (AI) Shows Signs of Wyckoff AccumulationAI Stock (C3.ai)
C3.ai (Ticker: AI) is currently trading just above key long-term support levels, exhibiting behavior that closely aligns with the Wyckoff Accumulation model. The stock has shown resilience after a prolonged downtrend and is now forming a potential accumulation base near its recent lows.
Notably, the Relative Strength Index (RSI) remains below the 50 level, indicating that momentum is still in the early recovery stages—offering room for a potential breakout as accumulation matures.
Historically, C3.ai has demonstrated a tendency to fill prior downside gaps, especially during periods of low volatility followed by volume spikes. This current structure suggests smart money may be stepping in quietly, absorbing selling pressure in preparation for a markup phase.
If price holds above the current base and begins to show a Sign of Strength (SOS) with increasing volume, a breakout toward previous gap levels becomes a strong technical possibility.

Is C3.ai the Quiet Giant of Enterprise AI?C3.ai (AI), an enterprise artificial intelligence software provider, has operated somewhat under the radar despite its foundational role in delivering advanced AI solutions to large organizations. While the broader AI market has seen significant attention on hardware innovators, C3.ai has steadily scaled its platform usage and secured marquee contracts. The company's core strength lies in its sophisticated, patented C3 Agentic AI platform, developed through a multi-billion-dollar investment, which effectively tackles critical business challenges such as AI hallucinations, data security, and multi-format data integration.
A pivotal development underscoring C3.ai's growing influence is the expanded contract with the U.S. Air Force Rapid Sustainment Office (RSO). This agreement significantly increased its ceiling to $450 million through 2029, supporting the widespread deployment of C3.ai's PANDA predictive maintenance platform across the Air Force fleet. This substantial commitment not only provides a robust, long-term revenue stream but also serves as a powerful validation of C3.ai's technology at an unprecedented scale, potentially representing the largest production AI deployment within the U.S. Department of Defense.
Financially, C3.ai demonstrates compelling momentum. The company recently reported record Q4 earnings, with revenue reaching $108.7 million, a 26% year-over-year increase, driven by strong growth in both subscription and engineering services. Strategic alliances with industry giants like Baker Hughes, Microsoft Azure, and Amazon Web Services continue to accelerate new deal flow and expand market access, shortening sales cycles and enhancing overall reach. While profitability remains a near-term focus, C3.ai's solid liquidity and projected revenue growth of 15%-25% for fiscal 2026, coupled with an average analyst price target suggesting significant upside, position it for a compelling ascent in the enterprise AI landscape.

$AI is setting up for a 30% move!C3.AI - NYSE:AI Trade Setup
Inverse H&S Breakout that is now retesting.
A bounce here would confirm the breakout and lead to a MM up to $32.59 for a 30% move!

AI: Round 2AI
The market is really just that simple — it goes around in circles with the same style.
Will you catch AI and go up round 2?
.
US STOCKS- WALL STREET DREAM- LET'S THE MARKET SPEAK!

SPY, SPX, IWM, Natural Gas, NVDA, XYZ, AI - Analysis- Markets sold off into the NVDA rally this morning.
- Small afternoon rally turned indices back green
- Major pre market high levels up ahead likely allow us to push higher in coming days.
- NVDA should retest its premarket high levels.
- Profits secured on AI calls!
- Structurally indices are still bullish and remain above key levels.
- Yields see nasty reversal lower and look to be going down.
- Natural Gas trying to lure investors with a bottoming tail - but i think its false hope.

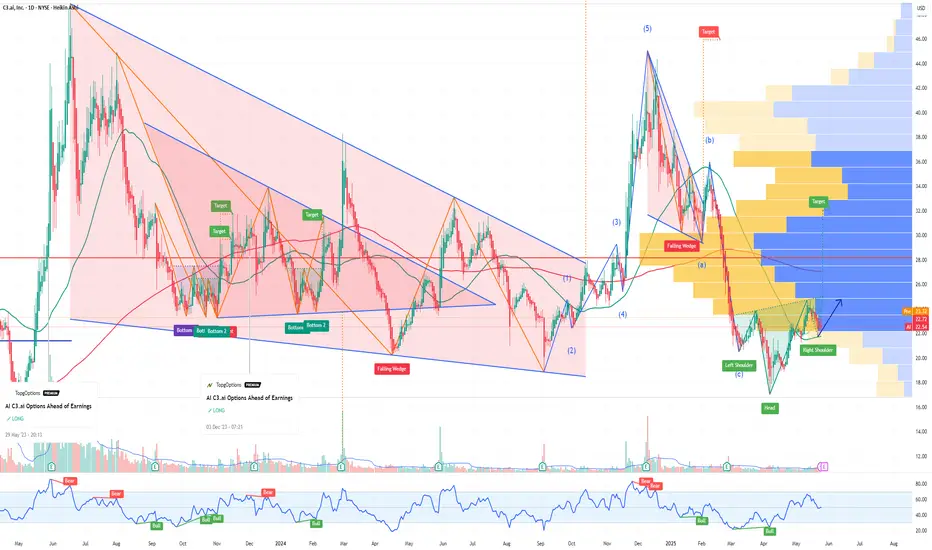
AI C3ai Options Ahead of EarningsIf you haven`t bought AI before the previous earnings:
Now analyzing the options chain and the chart patterns of AI C3ai prior to the earnings report this week,
I would consider purchasing the 23.5usd strike price Calls with
an expiration date of 2025-5-30,
for a premium of approximately $1.31.
If these options prove to be profitable prior to the earnings release, I would sell at least half of them.
$AINYSE:AI reports earnings post-market tomorrow.
👀 Watch the pre-market volume closely.
✅ If volume picks up, expecting range to hold (purple line on chart) with a move toward $25–$24.
🚀 Breakout above that could push price to $28–$29.
📊 NYSE:AI remains undervalued — once it clears the $30 zone, pullbacks may be limited.
📈 Long-term potential targets: $40, $50, and beyond.
30-min chart included for context.
#AI #C3ai #Stocks #Trading #Earnings #TechnicalAnalysis

C3.AI has bottomed and is targeting $39.00C3.ai (AI) has been trading within a Channel Down pattern since the June 16 2023 High and right now is testing its 1D MA50 (blue trend-line) as Support, following a bottom (Lower Lows) rebound on April 08 2025.
This is technically the start of its new Bullish Leg, even though based on May - August 2024, it may be delayed. On the long-term though, our Target will be the 0.786 Fibonacci retracement level at $39.00.
-------------------------------------------------------------------------------
** Please LIKE 👍, FOLLOW ✅, SHARE 🙌 and COMMENT ✍ if you enjoy this idea! Also share your ideas and charts in the comments section below! This is best way to keep it relevant, support us, keep the content here free and allow the idea to reach as many people as possible. **
-------------------------------------------------------------------------------
💸💸💸💸💸💸
👇 👇 👇 👇 👇 👇

AI (C3.ai) – Bullish Reversal Setup on 30-min Chart!
📊 Trade Setup Summary
Pattern: Falling wedge breakout → Potential bullish reversal
Entry: Around $21.87 (breakout area, marked with yellow circle)
Stop-Loss (SL): $21.28 (below key support zone in white)
Target 1 (TP1): $22.92 (red resistance line)
Target 2 (TP2): $24.22 (green resistance zone)
📈 Technical Insights
Price broke above a falling wedge, typically a bullish reversal pattern.
The yellow line marks horizontal support — price bounced from here.
Green candle off support = buyer interest.
Volume is light for now (55.49K), but breakout structure is clear.
Risk/Reward is solid, with R:R ratio ~1:2+
✅ Bias
Bullish above $21.28
Neutral around $21.50–21.87
Bearish only below $21.28
📢 Optional Caption (Social Media Ready)
🚨 AI Breakout Setup
📈 Falling wedge breakout (30-min chart)
📍 Entry: $21.87
🛑 SL: $21.28
🎯 TP1: $22.92
🎯 TP2: $24.22
⚡ Reversal from key support – wedge breakout!
🏷️ Hashtags
#AIStock #BreakoutSetup #TradingView #ProfittoPath #OptionsTrade

AI: When?AI: When?
-Tweetzer candle pattern.
-Consolidation in tight range at the bottom with low supply volume.
.
Wait for break soon!
US STOCKS- WALL STREET DREAM- LET'S THE MARKET SPEAK!

Technical Pressure, but a Bullish Setup Brewing? Open AI🚀 C3.ai (Ticker: AI) – Technical Pressure, but a Bullish Setup Brewing?
C3.ai has faced a sharp decline in 2025, slipping below key industry benchmarks and triggering technical warning signs. The stock is currently trading under both its 50-day and 200-day simple moving averages (SMAs), signaling short-term weakness.
However, Black Whale's technical team has identified a powerful formation: C3.ai has touched the same support zone four times, creating a solid base around the $17–18 range. This repeated bottoming behavior signals strong demand at lower levels and a potential launchpad for upside movement.
C3.ai Underperforms Sector – But Could Be Undervalued
So far this year, C3.ai shares have dropped 40.8%, significantly underperforming the Black Whale Computer & Technology sector benchmark, which fell just 14.9%, and the Black Whale IT Services industry index, down 17%. The economic slowdown has caused many businesses to reduce spending on advanced tech solutions, impacting demand for C3.ai’s enterprise-focused AI platforms.
The company also faces profitability challenges due to high operational costs from scaling, onboarding partners, and supporting global infrastructure. Still, at current levels, the stock trades at a 54.8% discount to its 52-week high of $45.08 — while sitting nearly 20% above its 52-week low of $17.03, reaffirming the technical floor.
Analysts Turn Slightly More Optimistic
The Black Whale analyst consensus for C3.ai’s FY2025 and FY2026 losses has improved in the last 60 days, with estimates narrowing to a loss of $0.45 (from $0.62) and $0.46 (from $0.55), respectively. Revenue estimates are also encouraging: expected to grow by 29.7% in FY2025 and 22.4% in FY2026.
Partnerships Driving Momentum
Strategic alliances are fueling C3.ai’s global expansion. The partnership with Microsoft continues to deliver, with 28 new joint deals closed across nine industries. Sales cycles with Microsoft have shortened by 20%, thanks to improved go-to-market alignment. Currently, over 600 active enterprise opportunities are being pursued globally under this collaboration.
C3.ai has also deepened partnerships with Amazon Web Services (AWS) and launched a new collaboration with McKinsey’s QuantumBlack. These partnerships are turning into real revenue engines, allowing C3.ai to scale with minimal direct customer acquisition effort — 71% of Q3 deals were partner-driven.
Major new or expanded clients include GSK, Sanofi, ExxonMobil, Shell, Quest Diagnostics, and the New York Power Authority, along with deals in the U.S. federal sector with the Navy, Air Force, and Missile Defense Agency.
Leading the Charge in Generative and Agentic AI
C3.ai is positioning itself at the forefront of Generative and Agentic AI. In Q3, the company launched 20 new Generative AI pilots, including projects with Mars and multiple U.S. government agencies. A new time-series embedding model is accelerating deployment in complex enterprise environments. With over 130 pre-built AI applications, C3.ai is shifting from a model builder to a results-driven AI platform.
Financials – Revenue Growth Despite Headwinds
For fiscal Q3 2025, C3.ai reported $98.8 million in revenue — a 26% year-over-year increase. Subscription revenue made up 87% of that, growing 22% to $85.7 million. Notably, demo licenses used by partners like Microsoft and AWS brought in $28.6 million, showcasing the power of channel-led sales.
Valuation and Investor Outlook
C3.ai is trading at a forward price-to-sales (P/S) ratio of 5.71, which is slightly above the sector average of 5.39 but still below its historical average. Given the growth, partnership momentum, and strong bottoming structure, the Black Whale research team believes C3.ai may be entering a reversal phase.
Black Whale’s Take – A High-Conviction Watchlist Stock
Despite being under pressure, C3.ai is showing clear technical strength with four confirmed touches at its support base, solid revenue growth, narrowing losses, and a growing global footprint through powerful partnerships.
From our perspective at Black Whale, this is a high-conviction watchlist stock with real upside potential. With the right market sentiment and follow-through from institutional players, AI could be setting up for a strong rebound.

C3.a1 - Buy now !!!C3.A1 my fav share is ready for big breakout. It is forming falling wedge and ready for big move...
Targets are mentioned in the chart

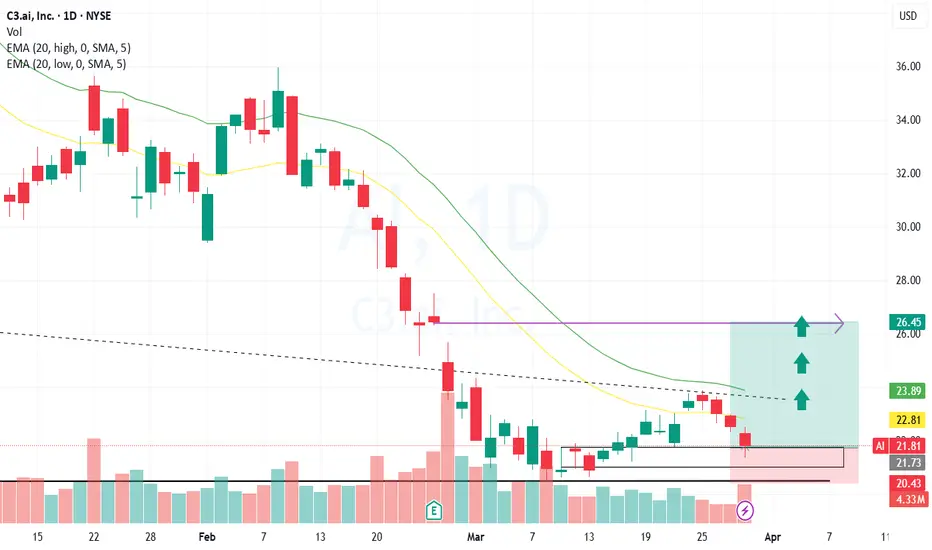
Continue to consolidate before the breakout to 26There is a significant gap to fill at 26. I do see potential, and it has been showing signs of finding its feet. Look forward to a higher mark as to why it's simply by design and concurrent with market conditions and display from others in AI to mark a significant move for themselves. With this being marked so low, ATM could prove vital, statistically as well as effectively.
Watch this one close in the next few weeks!boost and follow for more 🚀 I am loving this AI setup, bouncing from multiple support zones and breaking multiple trend resistance lines, now we just wait for the pivot level break of 24.31.
A rally higher to 28.95-36.04 should follow if we get a trigger. 🎯On my watchlist for now!
Side note: I did change my name to AuraTrades today, boost if you like the name change! i got tired of the last name

$AI – Price at a Pivotal Level | Bounce or Breakdown?📊 C3.ai ( NYSE:AI ) is sitting at a critical support level.
🔹 Price Action & Key Levels
Current Price: $21.61
Previous Week Range: Mon, Mar 3 - Sat, Mar 8
Previous Weekly High (PWH): $24.35
Previous Weekly Low (PWL): $20.92
Previous Day Range (Fri, Mar 14, 2025) is a crucial demand area.
Previous Day High (PDH): $21.78
Previous Day Low (PDL): $21.20
Fibonacci Range: Wed, Dec 28, 2022 - Fri, Jan 16, 2023
Fibonacci 0.618: $24.95 (Resistance if the stock bounces)
Fibonacci 0.786: $18.44 (Downside risk if support breaks)
🚀 Bullish Case (Price Needs to Hold & Bounce)
If NYSE:AI holds above $21.20 and reclaims $22 and $23, momentum could push it toward $24.35 and higher. Price above $24.95 (0.618 Fib) confirms strength to the upside.
🚩 Bearish Case (Break Below $20.92 = Danger)
If NYSE:AI breaks below $20.92 (PWL), the next downside target is $18.44 (0.786 Fib).
📌 Holding NYSE:AI 21 MAR 25 $23 Calls @ $0.30
- Entry: Higher low and between the 0.618 and 0.786 ($18.44 - $24.95) Fibonacci range to the upside.
- Target: $0.45 on the options contract, 50% profit
- Stop Loss: $0.20 on the options contract, 33% loss.
🔹 What Does C3.ai Do?
C3.ai ( NYSE:AI ) is an enterprise AI software company that helps businesses predict, automate, and optimize operations using AI.
💡 Example Use Case:
Shell (Oil & Gas) uses C3.ai’s predictive maintenance AI to analyze sensor data and detect equipment failures before they happen—reducing downtime and saving millions.
Some other industries and areas NYSE:AI is doing business in:
Banking: Fraud detection & risk management
Healthcare: AI-driven diagnostics
Manufacturing: Supply chain optimization

C3.AI ($AI) Bullish Reversal Pattern C3.AI recently broke out of a bullish flag formation, signaling strong upward momentum. After the initial breakout, the price is now retracing, potentially retesting the former resistance of the flag as support. This retest could serve as a confirmation of the breakout before the next leg higher.
Technicals:
Volume Analysis: The breakout was accompanied by strong volume. Recent decrease in volume can be interpreted as a good sign and a prelude to the next leg up.
Relative Strength Index (RSI): The RSI is currently in the neutral zone (mid-40s) and showing a gradual uptick. While it’s not oversold, the upward trajectory signals improving momentum and aligns with the bullish price action. However, due to C3.AI's relatively young market history, the RSI may be noisier and less reliable as an indicator, requiring additional confirmation from other technical signals.
Price Projections:
Patience is key, however, based on the pattern we can expect the followings:
Initial Target: $40 remains the first target, based on historical resistance levels.
Secondary Target: $50 and beyond, achievable if the retest is successful and volume supports renewed bullish momentum. Expect some consolidation.
A price decline below $24 would completely invalidate this setup, signaling a potential reversal or deeper consolidation.
Some Thoughts on C3.AI:
C3.AI is at a critical juncture following its bullish flag breakout. The current retracement could be a healthy retest of the breakout level, offering an opportunity for traders to enter or add to their positions. C3.AI presents a ripe opportunity for opening a long position, but patience is key.

Bullish C3 ai, Inc. Symmetrical Triangle We have identified a bullish symmetrical triangle on C3.ai Stock . At the moment price is testing breakout levels as well as weekly Gaussian Channel support. If confirmed price will most likely react to symmetrical triangle potential and continue moving towards its 200% Target of about $88.00 per share.

Long $AI from $28 - $30 to $35 - $40, as I see an ascending triaOption trading ideas:
Buy Call strike $30 exp 3/21
Buy Call strike $35 exp 4/17
Or load the shares at $28 - $30, Target $35 then $40 in the next 4 - 8 weeks.
Be careful the result of Earning call may break this idea.
Disclaimer


