AI to All Time HighsA break of the last local low of 25.54 is clear invalidation. Todays low of 26.42 should mark the low going forward.
1C3 trade ideas

AI AnalysisPrice is on a steady downtrend. Price has recently filled the fair value gap at 29.55. I'm expecting price to continue lower into the bullish OB at 23.82 to mitigate the orders before waiting for confirmation to go long from here.

Major support areaWe have confluence with 200 MA and Touching the channel. Big move either up or down coming very soon

Ai looking to fill GAP with as hype continuesAi and NVDA hype continue regardless of fundamentals. Ai is one of the most shorted stocks we trade and is looking to quickly fill this daily gap for a quick 11% spot move. A higher price target is the 20 day SMA.

C3.AI - A Highly Volatile Fade With A Big RewardWhether you like it or not, the AI pump, even though it lasted for four months, has come to an end, because "artificial" has never been much of a compliment in the first place.
Consider this:
Artificial butter is called "margarine" and if you use it in pastries in France you'll go to prison
Artificial milk is called "soy drink" and if you drink it then you'll get hormonal problems.
An artificial bed is called a "couch" and you only sleep on it when you did something stupid and hurt your wife's feelings or have become poor.
Regardless, C3.AI, just like Docusign, shows curious signs that it should rally and be a big bagger in the future, but the timing for it to do the go train doesn't make sense at present.
I outline Docusign here:
Docusign - In Theory, A Long-term Technical Multibagger
for C3.AI, the evidence is made the most clear on the monthly bars, which is the big gear that dominates all the smaller time frames anyways.
The point is this:
1. All price action in the four month pump was simply retracing a mid-2021 gap down liquidity void, as evidenced by the bodies of the candles and the move away from the level.
2. The big "omg ChatGPT" pump candle from May, which formed an outside reversal bar, has had the 50% level traded through on two monthly bars
3. The May low of $16.79 is still higher (and meaningfully so on a % basis) than the $13.37 level, which amounted to little more than a stop raid during the 2022 lows
4. These numbers and ranges are enormous in magnitude, but C3 is a very, very volatile stock and only worth $3.16 billion at current levels
5. The same idea for an upside gap play exists at $90, and a strong Q4 rally is extremely possible.
So, let's say that the market makers are willing to take price on a 300%+ moon mission. Let me ask you a question, is it very likely that this will happen before, or after, some sort of manipulation to the downside that shakes out weak hands?
The answer is obvious, and so the target is circa $15 in the remaining portion of September and/or October.
The problem with going long the bottoms on the pump thesis is that the situation in Mainland China with the Spectre of Communism controlling the "Chinese" Communist Party is that the CCP is about to fall.
The Yuan is in rough shape, property developers and commercial real estate are about to explode like they ate a crit from the rocket launcher in Quake 4, and cities are starting to appear empty as a result of Mainland China, the world's motherland, being made empty as a result of the Wuhan Pneumonia epidemic.
And to think that all these problems are nothing more than a prelude to the real elephant in the room: the 24-year persecution and organ harvesting genocide against Falun Dafa's 100 million practitioners launched by the CCP and former Chairman Jiang Zemin on July 20, 1999.
The CCP, Xi, the remnants of the Jiang Faction, and the "International Rules Based Order" that smeared its hands participating in the persecution to court Shanghai and Tsinghua Marxist-Leninist vows for material benefits, can absolutely not escape the consequences of these crimes against humanity.
Humans won't hold people responsible, but Heaven will. There will never be a Nuremburg 2.0, and there won't be a "Great Judgment," but there certainly will be a historic retribution for evil that will be passed down forever.
And this makes long into January of 2024 as the market rallies extremely dangerous.
I can only ask you to consider hedging with volatility when you see the VIX at a 9-handle in November and an 8-handle in December.
When "That Day" really comes, everything will be over in a night.
And it will be too late to cry. You'll be trapped on the greatest gap of all time.

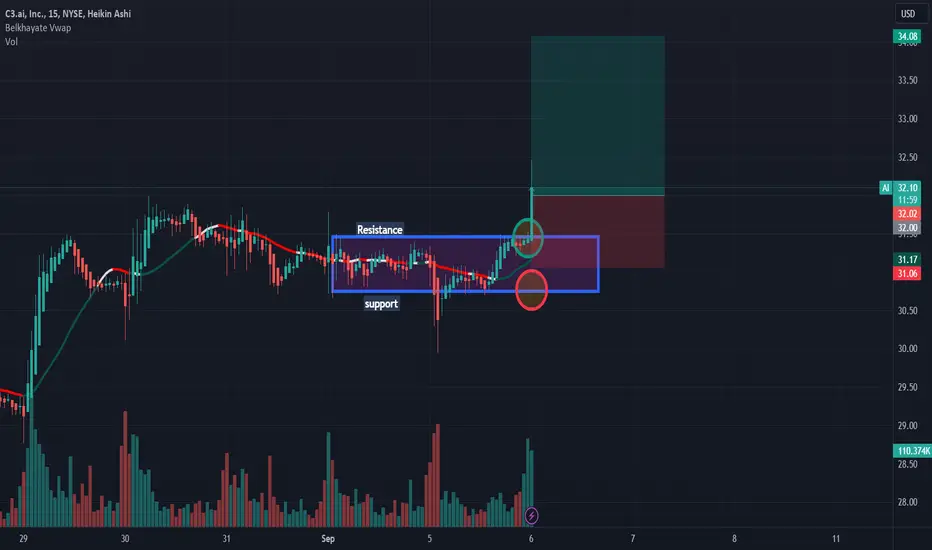
AI: Sell ideaOn AI as you see on the chart we will have a big probability to have a big downtrend after the breakout with force the vwap indicator and the support line by a big red candle with a large red volume. Thanks.

Key Considerations for C3 ai Stock as It Approaches EarningsC3.ai (NYSE: AI) specializes in enterprise AI solutions and has a foothold in industries such as energy, healthcare, and manufacturing. The company saw a 40% revenue growth in fiscal year 2022, and analysts predict a further 30% growth for fiscal year 2023.
**Market Context: Critical Price Level and Earnings**
The stock is currently at a pivotal price level of $31, with earnings due after market close today. If C3.ai maintains its high-growth trajectory as in previous quarters, we could see the stock targeting new highs of $36, $40, $48, and $50.
**Growth Drivers:**
- The rising adoption of AI in business sectors like customer service and supply chain management is fueling C3.ai's growth.
**Risks:**
- C3.ai is still not profitable and faces competition from tech giants like IBM, Microsoft, and Google.
- The AI market is still maturing, and its growth rate could slow down.
**Additional Considerations:**
- **Competitive Landscape**: C3.ai faces competition but also collaborates with tech giants like Google and Microsoft.
- **Financials**: The company's strong revenue growth suggests a path to profitability in the near future.
- **Management**: Led by a capable team with a history of success.
- **Partnerships**: Strategic collaborations could expand the company's reach. (such as Google and Microsoft).
- **Product Innovation**: Ongoing development keeps C3.ai at the forefront of the AI solutions market.
**Summary:**
C3.ai presents a high-growth opportunity with certain risks. Its position in the expanding AI market makes it a compelling investment option, but due diligence is crucial.
I hope this analysis aids in your investment decision-making process. Finally, if you like what I am doing and you want more hit the like, and follow me on my X account. Dr Saud

AI: Buy ideaBuy idea on AI as you see on the chart because we have the breakout with force the resistance line by a big green candle with a large green volume. Thanks!
AI C3ai Options Ahead of EarningsIf you haven`t bought AI here:
Then analyzing the options chain and the chart patterns of AI C3ai prior to the earnings report this week,
I would consider purchasing the 30usd strike price Calls with
an expiration date of 2024-1-19,
for a premium of approximately $6.55.
If these options prove to be profitable prior to the earnings release, I would sell at least half of them.
Looking forward to read your opinion about it.


C3.ai, Bearish Trend ContinuesOnce again I hate to be the Bearer of bad news but I'm not seeing anything good on the C3.ai Chart. I've tried to map out the most basic indicators so that you're able to see what I see. In fact what I see is that the Bearish Trend has been gaining strength if anything. For 20 days now it has been trading below the 7 day EMA and well below the 50 day ema. We have negative signals all over and the Money Flow Index as well as the TSI are both very negative with no reversal in the near term. I believe that with the current trend and today's Bearish Engulfing Candle along with trading volume at double of what your normal day is of 10 million shares that the potential for C3.ai to break through the bottom trend line of the Bear Channel they're in (since the middle of June) is very real with my price target shown on the chart at $23.68
The only immediate Potential Support is that after today's candle it's resting on the 200 day EMA, but that's not much to go on.

AVWAP Earnings Rejection Based upon the VWAPs anchored to earnings shows rejection on its recent rally, could prove more downside in prices.

C3 ready to $82(131%)My reading is:
1- Primary : it is in the 3rd Elliott wave
2- Minor : finished the 1st wave of the primary 3rd
finished the 2nd wave of the primary 3rd
Forecasting :
Conservatively : it may go to the upper bound of the channel $82 (131%)
Unconservative : it may extends to the 1.61% Fibonacci around $150 (330%)
Notice: watch for the earning announcement on the 6th of Sept
The information is not meant to be, and do not constitute, financial, investment, trading, or other types of advice or recommendation.

Complex pullback in C3.AI stock!On Monday, the bulls returned to the C3.ai stock following the signing of a new contract with a significant branch of the American military.
This development sent the share price of the AI specialist rocketing more than 8% higher so far this week, outperforming the week’s 1% increase in the S&P 500 index.
You can now spot a spring pattern after what Lance Beggs would describe as a complex double-swing pullback .
A daily close above $32 should be the beginning of a new rally to $48.

C3.ai, Near Pre-Earnings BottomRight now there is more Negative or Bearish Signals dominating the chart than Bullish signals but the next couple of days could be pivitol for a short term reversal with a potential spike lower to $31.00. Earnings are 2 weeks away and with any Positive Earnings News causing Bullish Momentum the possible top is $39.00. That would be an $8.00 swing for a potential 25% gain.

A second leg is chance to buy | $29Daily chart
C3.ai ( NYSE:AI ) increased over 381% from Jan 2023 and it's trading at $39,25 after drop from ATH on Jun at $48,87
The first leg is completed and wait for a second leg to buy around $29
Wait and see C3.ai growth in the future

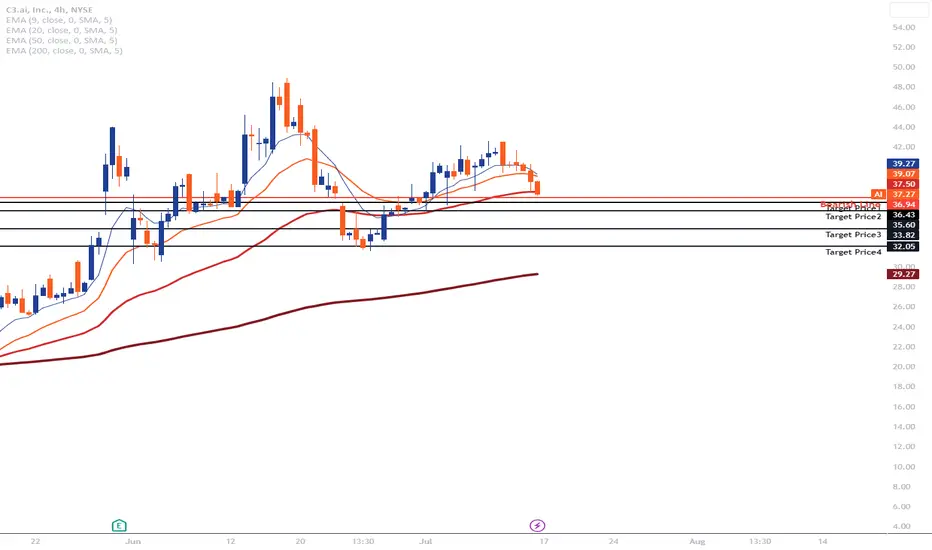
AI | InformativeNYSE:AI
The bearish line is identified at 37, which may indicate a bearish signal and potential downward price movement. In this scenario, the target prices could be set at 36.43, 35.60, 33.82, and 32.05.
*In addition to the provided information, I have observed three black crown candlesticks, which typically signify a bearish pattern. Furthermore, on the 1-hour chart, the price is in close proximity to the support of the EMA200, located at 36.99. These factors further support a bearish outlook for AI.
C3.AI stocks suppressed by the 1.618 level of the golden sectionC3.AI stocks suppressed by the 1.618 level of the golden section
This chart shows the weekly candle chart of C3. AI stocks for the past year. The graph overlays the low point at the end of 2022 against the golden section. As shown in the figure, the high points of C3.AI stocks at the end of May and July were precisely suppressed by the 1.618 level of the golden section in the figure, while the high point in June almost touched the short start level in November 2021! So for a period of time in the future, the probability of C3. AI stocks will probably rise again against the 0.618 to 0.809 positions in the golden section of the pullback chart!

Last stand of this being an ImpulseIm almost in disbelief that we will see a wave 3 forming from this suggested wave 1.
wave 2 way too deep. I would have to wait and see the further developement. I think that we might see lower prices so therefore , i would have to change the count.
But not just yet.
Last stand

AI 12H (Bullish Scenario)Following the break of the $33 region, C3.ai's stock price is gaining momentum, as long as this region is held, it could potentially move higher again

AI - BreakoutBought in NYSE:AI stock 🚀 This stock has enormous potential for growth! Our target is at $63 🎯 The hype around AI is real and still has lots of room. Higher volume on bigger candles is a healthy signal for this breakout.

AI is showing bullish momentumI like the short-term price action on this one. Looking at the 4hr chart, I see that a trading range has developed. The trading range shows higher lows and higher highs. That is the foundation of an uptrend. Within that uptrend on the 10min chart, I see that an ascending triangle is formed. Ascending triangles are characterized by flat tops and rising lows. It shows that buyers are getting more aggressive and sellers remain stagnant. Eventually, the buyers should surpass the sellers. A break of the ascending triangle gives me confidence that the uptrend will continue to the upper end of the range. There has also been a heavy amount of call option buying and put option writing which suggests that institutions may want to take this higher as well. I am watching the following levels closely...
Entry above 42
Stop below 40
Target1 44
Target2 47

$AI to $65NYSE:AI - One I have been watching for a while.
Purchased this stock at $15.59 and still holding.
I am going to re-enter some options as I am expecting a bullish continuation to at least $65 before a significant retracement.
Wave 3 Target: $56
Wave 5 (Final) Target: $65
Options idea: $50 strike with 1st September 2023 expiry with 10% SL. Currently contracts are price at $320.
