COP: Potential 240M 3-Drive completion Time for some mean reversion play. COP is the sore thumb sticking out amongst the oil plays with the stock making new highs post Feb crash. With results coming up and WTI completing its own 3-Drive formation as the pipes out of the Permian get clogged, it would be a good idea to put on some downside directional trade on COP. Given the out performance vs. the XLE, I would be inclined to look at a -COP/+XLE relative trade here.
1COP trade ideas


Short term bullish, mid term bearish, long turn bullishIt looks like COP has been trending nicely for a few years and I expect the range highs to continue due to seasonality. Will look to revisit this in the low 50's around October.

COP hit wave 4 bottom?I was expecting COP to drop soon, did not think it would be so quick nor a one day event. If yesterday was truly the bottom and wave 4, we should be on our way to 63 level and beyond. This should occur within 2 weeks

COP Long Swing PlayOIL Play. COP broke out of coil recently on daily chart. Break of horizontal resistance around 58 ish can get this up to 62 (based on depth of W pattern).
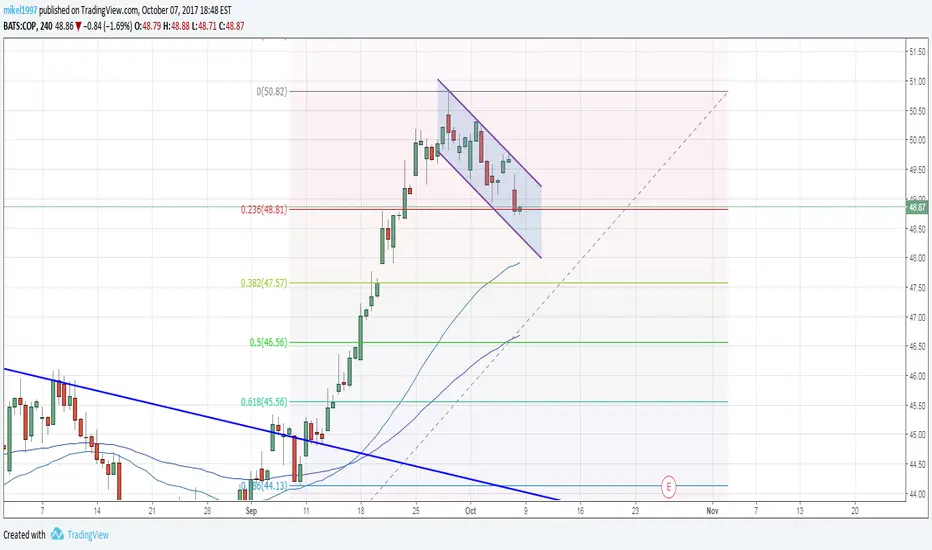
Notes on chart.

ConocoPhillips Continues Upward MovementStock should move to at least 63.5 over next few months to finish a few wave 5s.


Bullish Oil Futures = Energy Companies #8 (COP)Back in February 16 to 17 I shared 3 chart ideas that look like this chart
this chart is a mirror of the past ideas based in Resistance becomes Support.
Resistance breakout, pullback and swing low confirmed
Red arrows speak for me

ConocoPhillips still on track to drop by end of FebruaryMy Cycle wave 3 top appears to have been originally off by 7 trading days. This does not appear to impact the pending drop. The estimated upcoming bottom for COP is around 56.20 on March 5, 2018.


Estimate Waves 4 and 5 for ConocoPhillipsIn assuming Cycle Wave 3 topped out on January 12, we have laid out estimated points for Waves 4 and 5. Wave 5 will also end Supercycle Wave 3. We have broken it down more on our site.

Elliott Wave Projection For ConocoPhillipsWe have identified the Macro waves and pointed out the most recent minor waves. I believe we just completed Wave 3 of a Cycle Wave, as well as Wave 5 of a Primary Wave.

ConocoPhillips Is Set To Gain At Least 45%ConocoPhillips should rise at least 45% by the end of 2019 from Friday's close. Can you beat 45% gain in 20 months? In the short-term the stock should zig-zag to this point. Stock will most likely:
drop toward 55.93
rise toward 70.07
drop toward 59.75
rise toward 87.00 to close out its Elliott Wave Grand Supercycle and achieve at least a double top.
I will publish the full breakdown and track the process on my site


COP - Feb.'18 Exp. Put Vertical Debit SpreadTrade details:
57.5/50 Put Vertical Debit Spread @ $3.01
Prob. of Max Profit = 10.86%
Prob. of Max Loss = 34.02%
Break-even @ $54.49
50 D.T.E.
Trade plan:
Entry by overbought status + indication of correction/mean reversion analysis.
Expecting pullback to moving average (VWMA) before earnings report in Feb.'18 for profit on weakening uptrend as seen in both Daily + Weekly charts.
Expecting to take quick profit at $53.70 level + will re-establish position if quick profit is possible.
Expecting to hold spread through earnings + allow spread to expire worthless if reversal is strong.
Adjustment will be made if the position goes strongly opposite past $56.40 resistance level.

Conoco Philips needs to pull back to 48.50Bearish divergence. I am selling. Support for Conoco at 48.50, and strong support at 47.
Not qualified as a securities professional.

Did ConocoPhillips (COP) Just Exhaust Itself?ConocoPhillips has climbed quickly in the previous month. The stock should not remain at such a high level according to technical indicators and historics, Will it head south with strong action around the 46 level?
When we look at technical indicators, the relative strength index (RSI) is at 65.6636. RSI tends to determine trends, momentum, overbought and oversold levels as well as likelihood of price swings. I personally use anything above 75 as overbought and anything under 25 as oversold. Currently the RSI has come down from overbought levels. The historical significance of this move and it current level are detailed below.
The positive vortex indicator (VI) is at 1.2097 and the negative is 0.6935. When the positive level is higher than 1 and higher than the negative indicator, the overall price action is moving upward. When the negative level is higher than 1 and higher than the positive indicator, the stock is moving down. The positive and negative have begun to head back toward the 1 level after flirting with extremes consistent with positive stock movement. A retreat back to one typically flags the end of the upward movement while signaling a drop for the stock.
The stochastic oscillator K value is 90.4177 and D value is 93.3957. This is a cyclical oscillator that is highly accurate and can be used to identify overbought/oversold levels as well as pending reversals and short-term activity. I personally use anything above 80 as overbought and below 20 as oversold. When the K value is higher than the D value, the stock is trending up. When the D value is higher that the K value the stock is trending down. The stochastic is certainly in overbought territory The D value has just overtaken the K value at the time of writing; meaning the stock will continue to decline and could drop quicker than it rose.
SPECIFIC ANALYSIS
I have created an algorithm which signals when stocks are truly overbought and oversold. The algorithm indicates when a particular stock meets multiple criteria culminating in an oversold or overbought signal. The overbought signal could occur over the next few days. Seeing the other signs of a downturn, proactively positioning short for the stock's decline prior to seeing this verifying signal could increase profits.
Upon back-testing this indicator, it has signaled overbought status 73 times dating back to 1981. The stock drops at least 2% over the following 35 trading days in eighty percent of these occurrences. The stock drops at least 3% seventy percent of the time and forty percent of the time loses 6.25%. Even though a drop does not always occur, these number combined with the following statistics have instilled confidence that a greater than 5% drop is looming.
On 13 occasions since 1985, the RSI has exited overbought territory and been at its current level while the stochastic was simultaneously overbought and the positive VI was retreating from a level above it current one. This might not be a significant amount of data points, it is plenty for when studying historical movement. Based on this data, the stock sees a median drop of 12.09% over the next 20-35 trading days.
Between all of the aforementioned historics, we are confident the stock could drop at least 5-7% over the following 38 trading days. A SAG gauge signal would further bolster this idea.


Conocophillips Buy IdeaD1 - Two daily cycles ending around same zone.
Once this zone is reached we can start looking for buys after confirmation in the form of trend line breakout.

US STOCK CONOCOPHILIPS D1/H2Next potential chance on long trade.
Price created new impulse up with breaking ole peak, so now I wait until it will retrace to Fibo 61,8 % level and open buy trade.
