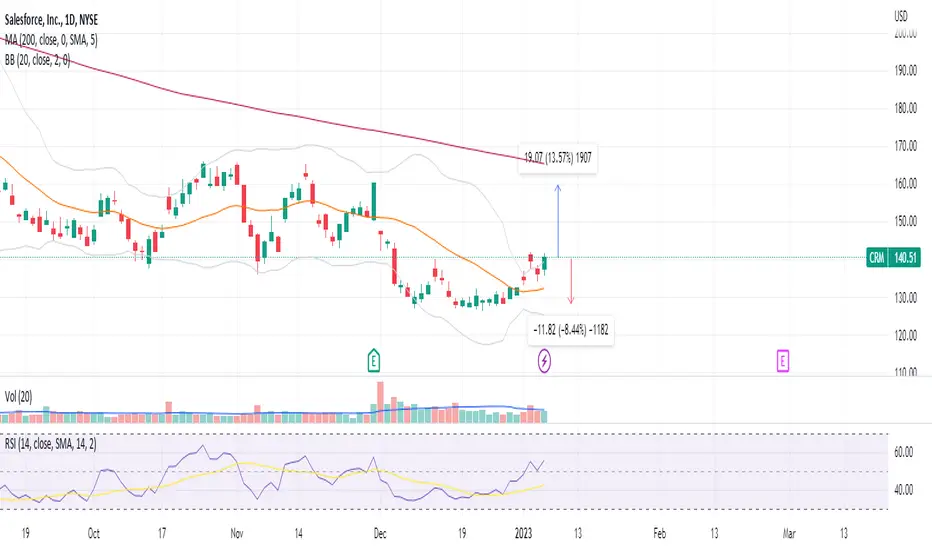
Salesforce CRM should recover to its 200SMA$CRM published not bad numbers in the last ES but the outlook looks not so optimistic. The stock sold off and now it`s recovering from the bottom on the general sentiment and news that the company announced a cost optimisation program. Look to buy with 200SMA as initial target and stop loss around 8-9% lower. There will be a time stop loss - if it doesn`t move the trade gets killed.
1CRM trade ideas
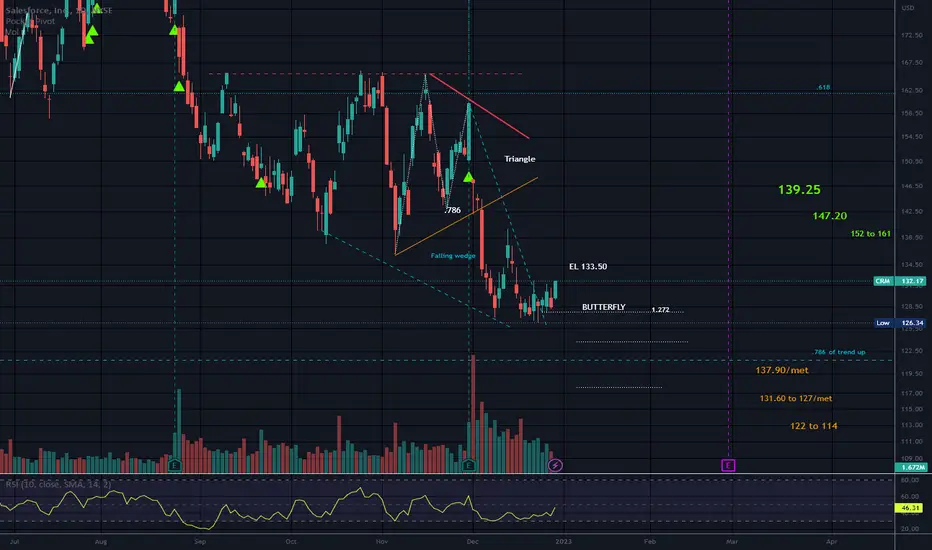
Market Darling is Making Some HeadwayWill momentum push through the R/Resistance overhead.
price has broken up through the Falling wedge. Both trendlines slop down in a Falling Wedge and narrow at the apex.
The bottom trendline of the triangle overhead may pose R as well as the top trendline of that triangle.
Looks like a W is trying to form but has some room to run. Small sup could be forming as well.
Possibly to the .886 or even the 1.113 is R levels let price through.
Price has met T1 to the upside.
No recommendation.

$CRM: Bullish signal$CRM is another stock that flashed a buy signal after an extended decline, interesting one here.
Best of luck!
Cheers,
Ivan Labrie.

$CRM Trade Idea Downtrend breakout on day w candle confirmation$CRM Trade Idea
Downtrend breakout on daily with candle confirmation
Calls over $151.55
Targets: $160.25, $162, $165.25
Puts under $144.30
Targets: $143.16, $140.50

Salesfoce was meant to rebound even before Elliot took a stake1. Salesforce is set to soar after Elliot Management took a stake.
2. Even before that, the stock was already forming a falling wedge pattern on the daily chart.
3. Salesforce RSI was also forming a bullish divergence pattern.

CRM D1 – BO, but Vol isn’t too convincing, wait for PBBOs are safe only when the market / sector looks healthy, otherwise it’s much safer to wait for PBs. Second mouse gets the cheese.


CRM LongDemand Zone
Earning 11/30/2022 positive reported 1.4
Entry 130
Stop 126
Target 165
Risk management is much more important than a good entry point.
I am not a PRO trader.
In my trading plan, the Max Risk of each short term trade should be less than 1% of an account.

CRM - BEARISH SCENARIOAfter a half-decade of fast hiring and large acquisitions, Salesforce is trying to cut costs and better integrate the companies it has purchased.
The 8 000 jobs cut announced on Wednesday is a step forward, but it won`t be enough to stop the downtrend.
The expectations are for the downtrend to continue and to reach the $ 115 major support level
Risk Disclosure: Trading Foreign Exchange (Forex) and Contracts of Difference (CFD's) carries a high level of risk. By registering and signing up, any client affirms their understanding of their own personal accountability for all transactions performed within their account and recognizes the risks associated with trading on such markets and on such sites. Furthermore, one understands that the company carries zero influence over transactions, markets, and trading signals, therefore, cannot be held liable nor guarantee any profits or losses.

The worst /best is yet to come.........Read the latest article here
We can expect more layoffs in the coming month from other non-tech sectors like retail, healthcare, manufacturing, services, etc. This data will be shown in the upcoming job employment data.
The FEDs as usual will not proactively resolve the problem but choose to procrastinate and being bureaucratic will spend time in meetings after meetings until the problem has snowballed to a certain size.
Thus, I won't be surprised if it breaks the support level at 114.19. When the US economy craters as it will this year (recession, unemployment shooting up) then the FEDs will wake up to halt the rates increase and begin the next round of QE once more. Yes, they will realise their QT has not solved the problem of inflation but merely kicked the can down the road.
So, this is a good time to do your research on the darling companies you always wanted to buy but is too expensive. There is no fear of missing out as it is too premature to call the US markets having bottomed out.
What you can do for yourself ?
Make sure you keep your primary job. This is not the time to play politics but rather be on the ball , haha. You never know when the axe is coming........
Update your resume and network and spread your name in your industry. A good word of mouth open doors !
Cut down on your spending. This can be hard for many people as it is a matter of habits. Do you really need that extra tie when you already have 10 in your wardrobe ? Or can you cut down on buying the premium beef in the supermarket ? Every cents count......
Exercise - Keep to a schedule of exercising at least 3-4 times a week. Be it running, walking, swimming, yoga, working out in gym, etc. It is better to have 30 minutes workout in one session than to have 2 hours stressful workout once a week.
This will keep you physically and mentally strong - remember healthcare costs will only goes up over time, never come down. So is your age and thus you need to watch your health.
Other sources of passive income - Investment by far is the most straight forward, imo but it requires capital. And time as well , the earlier the better. Upgrade your skills in areas of your interest and perhaps monetise it over time. Try out as many and failed just as many , all it takes is one good idea.
Most importantly, stay positive ! Avoid negative people who drained your energy and brings you down with your idea. Have faith, give it some action and work from there .....

Recession on the Horizon - FOMC and LayoffsYesterday, the FOMC confirmed the backing of higher interest rates for longer. The market reacted negatively signaling negative sentiment on rate expectations for the following quarters. Federal Reserve official, Neel Kashkari, who often has the most dovish views on market anticipation stated that inflation may have peaked but sees interest rates rising higher for the next few meetings. He sees the FED raising rates by a whole percentage point from the current level of 4.25%-4.5% to 5.4% (MarketWatch, Jan. 5). The inflation fight is not over yet, and it remains sticky despite all the economic weakening observed.
In a previous thesis where I challenged the US economy about a year ago, I warn of massive layoffs in 2023 despite most analysts and the Fed saying otherwise. Meta and Tesla have already laid off thousands of employees just months ago. Today, large layoffs in tech are happening with Salesforce: “layoff about 10% of its employees, the company also says it will close some offices as part of its recruiting plan, but it is still unclear if any of the bay area offices will be impacted, undertaking major cost cuts in a challenging economy.” (CNBC, Jan. 5). Amazon Chief Executive Andy informed his employees that the number of layoffs in the company has now been increased to more than 18000 roles (ArabianBusiness, Jan. 5). Other firms are cost cutting, most cutting employee benefits. It is just a matter of when or not we are going to see higher unemployment rates in 2023. The most obvious fundamental reason for these layoffs and cost cuts is the fact that all these companies responded to the “bubble” fueled by stimulus and extensive quantitative easing. As a response, the Fed is raising interest higher, and tightening the monetary policy and we see the equity evaluation of these companies dropping significantly. Eventually, that demand is gone, and these companies are left with thousands of employees hired in response to a "fake" demand, over-hired. As equity evaluation is going down, they have to improve the margins by laying off employees and reducing expenses since revenue is going down.
I see another reason for large layoffs, perhaps, a more IMPORTANT and IMMEDIATE aspect. Salesforce admitted business activities going down, demand slowing, and growth staggering, however, their stock went higher because they laid off employees, reducing their expenses. On paper, it shows higher margins, and thus, the stock reacted positively. What can become a norm during this economic environment is that we see more companies, especially in the tech industry which saw major lows, employing this technic by raising their stock prices with restructuring and engaging in mass layoffs.
My plan of limiting my exposure to risks has not changed. I am holding a majority in cash and short-term government bonds.
Looking to increase exposure to my trading in gold when the US 10-Year Real Rates falls from the inverse correlation between the two. Reminder: Higher real yields = expensive to hold gold when compared to other yielding investments such as fixed income, thus the inverse correlation on the charts.
This is for personal recording but feel free to comment and argue.

CRM BullishHere I bought a call debit spread on 01/04/2023 with expiry date on 02/17/2023.
Bullish Bias.
Here is the chart with support-resistance and target price zone.

CRM Salesforce - Weekly Chart ConcernHello friends, today you can review the technical analysis idea on a 1W linear scale chart for Salesforce, Inc (CRM).
The CRM price chart is self-explanatory. I posted about this stock in December 2021 and since that point, the price is down about 54%. It's not out of the water just yet as price has a possibility to head lower. There is a strong trend line where price may bounce from with historical support but that would mean price needs to come down another 29%. There is also a weekly Death Cross (50D and 200D SMA cross) that occurred recently, which may cause price to head lower. I have also included the Volume and RSI in this chart.
If you enjoy my ideas, feel free to like it and drop in a comment. I love reading your comments below.
Disclosure: This is just my opinion and not any type of financial advice. I enjoy charting and discussing technical analysis . Don't trade based on my advice. Do your own research! #millionaireeconomics

CRM Salesforce.com: Bigger Drop ComingHello friends, today I am completing a technical analysis on the 1M linear scale chart for Salesforce.com ( CRM ), traded on the NYSE.
#CryptoPickk notes the following:
1) Salesforce.com price has been falling month over month, down about 20% from it's all time high price.
2) The price has been supported by a multi-year arc line (in red color). In the past year, the price was supported by a rising trendline (in yellow color), however it broke that support and has potential to fall further.
3) Historically the price has had very large swings as shown in the chart.
4) Based on a Fibonacci Retracement, the price has the potential to touch the 0.236 level around $160-$165, which is also where the price can touch the multi-year arc line. This would be about a 48% drop from the all time high price.
5) There is also a multi-year Bearish Divergence which formed that is also a major reason why a further price drop may be coming. You can see the price has formed HIGH HIGH and RSI and Stoch RSI has formed LOWER HIGH.
6) Keep an eye on the RSI (relative strength index) as it has touched the 49-50 level historically before seeing a bounce. This may be a place to potentially start dollar cost averaging in.
7) This isn't the first time the price has potential to see a sizable drop as it has shown historically that it drops and then recovers.
What are your opinions on this?
If you enjoy my ideas, feel free to like it and drop in a comment. I love reading your comments below.
Disclosure: This is just my opinion and not any type of financial advice. I enjoy charting and discussing technical analysis. Don't trade based on my advice. Do your own research! #cryptopickk

MA bullish Butterfly is shaped like a crooked M. The 2nd leg pulls to the .786 and the 4th leg pulls close to the 1.272.
Peak 2 is lower than peak 1.
A falling wedge is opposite of a Rising wedge and both trendlines slope Down with the prevailing trend and narrow at the apex.
Price is between the .786 and the .618 of the trend up since the Covid low.
Since we are most likely in a Bear market, bullish patterns will be more apt to fail that bearish patterns.
Resistance overhead.
Short interest is less than 1%
No recommendation

CRM about to popSeeing accumulation on daily chart.. Someone has been buying this dip.
Entry - above 130
Stop loss -126
Target -140
Could break over 140 and keep going

How Low Will She Go? Candle InconsistencyPrice has busted the support line of the triangle (orange line).
Salesforce, Inc. has killed portfolio performance for over a year now and is still looking for a bottom.
I guess everything has a top and everything has a bottom.
There are 5 candles that have hit a low at this level, but price can still sail through this level like a missile on a bad market day like today.
I see a possible M The 2nd leg pulled to the .786 of the 1st leg. Leg 4 has hit the 1.272 and is where the 5 candles stopped but it does appear price is continuing to make new lows today. OUCH!
Falling wedge noted. A Falling wedge /blue/ is opposite of a Rising wedge and can be bullish . It is often found at the exhaustion level of a downtrend. The top trend line would need to be broken and price can also break down from a Falling wedge . The trendlines a falling wedge both slope down and narrow at the apex.
Short interest low at around 1%.
5 year low is 101.32. 3 year low is 115.29.
It just seems CRM may form a basing pattern soon like a triangle or a rectangle . Time will tell.
Today's candle differs here from the red inverted hammer that I see on TOS . This candle needs confirmation but one of the 2 platforms is incorrect.
An inverted hammer looks like a shooting star but the inverted hammer is found closer to bottoms whereas shooting stars are found at tops and are bearish .
A hammer at the bottom can look like a Hanging man at the top.
No recommendation.

CRM UPDATE CRM is complete a big contracting reverse triangle , wave C is a zigzag , and wave c of this zigzag is a terminal
at this levels i prefer to be a buyer for long time

Selling CRM at swing highs.Salesforce - 30d expiry - We look to Sell at 164.77 (stop at 172.51)
Intraday rallies continue to attract sellers and there is no clear indication that this sequence for trading is coming to an end.
166.59 has been pivotal.
166 continues to hold back the bulls.
Preferred trade is to sell into rallies.
The primary trend remains bearish.
Our profit targets will be 145.55 and 140.55
Resistance: 153.40 / 158.00 / 165.00
Support: 148.35 / 145.00 / 137.00
Disclaimer – Saxo Bank Group.
Please be reminded – you alone are responsible for your trading – both gains and losses. There is a very high degree of risk involved in trading. The technical analysis , like any and all indicators, strategies, columns, articles and other features accessible on/though this site (including those from Signal Centre) are for informational purposes only and should not be construed as investment advice by you. Such technical analysis are believed to be obtained from sources believed to be reliable, but not warrant their respective completeness or accuracy, or warrant any results from the use of the information. Your use of the technical analysis , as would also your use of any and all mentioned indicators, strategies, columns, articles and all other features, is entirely at your own risk and it is your sole responsibility to evaluate the accuracy, completeness and usefulness (including suitability) of the information. You should assess the risk of any trade with your financial adviser and make your own independent decision(s) regarding any tradable products which may be the subject matter of the technical analysis or any of the said indicators, strategies, columns, articles and all other features.
Please also be reminded that if despite the above, any of the said technical analysis (or any of the said indicators, strategies, columns, articles and other features accessible on/through this site) is found to be advisory or a recommendation; and not merely informational in nature, the same is in any event provided with the intention of being for general circulation and availability only. As such it is not intended to and does not form part of any offer or recommendation directed at you specifically, or have any regard to the investment objectives, financial situation or needs of yourself or any other specific person. Before committing to a trade or investment therefore, please seek advice from a financial or other professional adviser regarding the suitability of the product for you and (where available) read the relevant product offer/description documents, including the risk disclosures. If you do not wish to seek such financial advice, please still exercise your mind and consider carefully whether the product is suitable for you because you alone remain responsible for your trading – both gains and losses.

$CRM with a Bearish outlook following its earnings #Stocks The PEAD projected a Bearish outlook for $CRM after a Negative Under reaction following its earnings release placing the stock in drift D with an expected accuracy of 50%.


Symmetrical TriangleEarnings estimated to be 11-30 AMC.
Announce Date
11/30/2022 (Post-Market)
EPS Normalized Estimate
$1.22
EPS GAAP Estimate
$0.10
Revenue Estimate
$7.83B
Analyst EPS Revisions (Last 90 Days)*
Up-4 Down-9
Symmetrical triangles are neutral until broken.
No recommendation
