CrowdStrike going up!A bit unusual for me to try and make a idea about a specific stock, but here goes!
Crowdstrike has always been a darling for me and I have been in-and-out of the stock a couple of times, but this time im in it for the long run!
Clear upwards trend, with a nice couple of close support/resistance levels.
The current one we are at now from 168-169. Should go higher, based on their incredible earnings.
TP 1 - just above the 180-level, should be reached start-mid November and should hold that support.
TP 2 and 3 will be commented later!
Follow and keep track of the stock!
Good luck!
1CRWD trade ideas

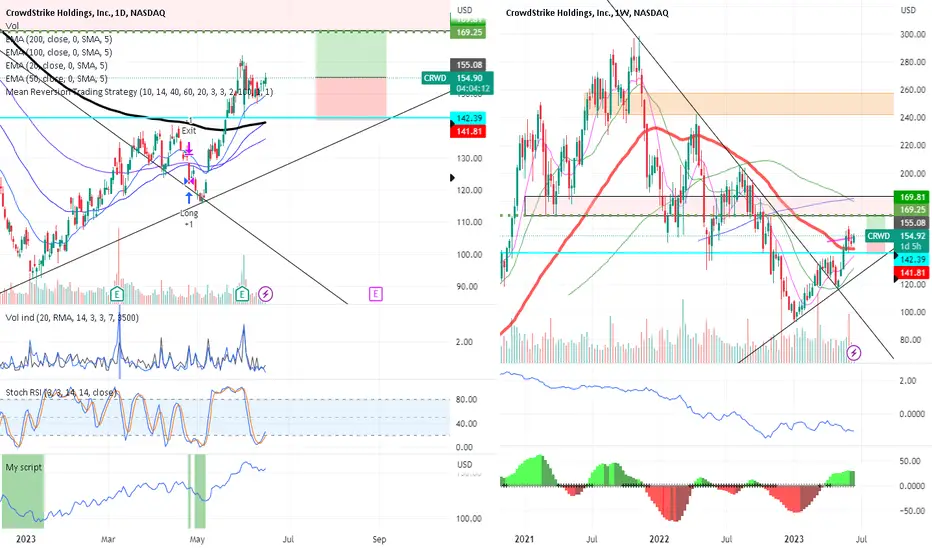
Crowdstrike Holdings Testing Support, Whats next?Hi guys! This is a Technical Analysis on Crowdstrike Holdings (CRWD) on the 1 Week Timeframe.
Since this is a WEEKLY chart, its important to note that the current candle is not yet confirmed and closes end of trading Friday, 08/11/2023
Lets take our attention to the Orange circle highlighting current price action.
We have reached a critical SUPPORT zone.
A place where 2 SUPPORT levels converge
1. BLUE LINE - the 21 W EMA
2. BLACK SUPPORT TRENDLINE - 6 month support trend line
Currently we have "WICKED" or bounced from this convergence of supports.
It is crucial that we close this weeks candle ABOVE this zone.
Critical also to stay above the 21 W EMA, as doing so indicates BULLISH TREND.
Confirming BELOW would indicate BEARISH Trend.
*** If we see confirmation of SUPPORT
-> this can be an ENTRY ZONE for a potential trade/bounce back up.
*** How ever its a little too soon to tell
We are also currently BELOW another TRENDLINE thats labeled "Support turned RESISTANCE".
It be nice to see PRICE get ABOVE this, come end of week.
Notice also the RED CIRCLE that shows our REJECTION from a convergence of RESISTANCE.
Here we have 2:
1. being the ORANGE horizontal resistance line
2. Slanted BLACK LINE
Take a look also at the LARGE UPPER WICK and how multiple candles have LARGE UPPER WICKS.
This indicates SELL PRESSURE and that this area is a tough area to break to the UPSIDE.
It can give off further bearish momentum to the downside.
We also have GOLDEN CROSS of the:
1. 21 EMA
2. 50 SMA
BUt this alone is not enough for the BULLISH CASE.
We need to have price stay ABOVE for it not to be short lived and become a FAKEOUT.
Worst case scenario for now if we CANNOT maintain SUPPORT at our current area.
ANd we end up breaking below 21 EMA & 6 MONTH SUPPORT LINE.
Look to the 50 SMA as a SUPPORT level, it is currently pointed down so where ever it converged with price action at the time if a hypothetical price decline.
If that fails, look to the ORANGE " Previous Resistance Trend from TOP" line. That would actually be a wonderful zone, provided we maintain SUPPORT.
-> This would be another zone to enter POSITIONS for a trade.
Now lets take a look at our Indicators.
1. RSI -> We printed a Lower High, with RSI going BELOW the BLACK Moving Average.
If you look LEFT, there is evidence that when we do this, price tends to drop. So be alert.
2. STOCH RSI is also in the process of printing a BEARISH CROSS. If this happens BEARISH moment will enter, leading to the probability of further price DECLINE.
-> If you look LEFT, everytime we point down, it has coincided with price DECLINES.
3. MACD, with the printing of light GREEN histograms that are small in size, this also is an indication of waning of BULLISH momentum. If we see a CROSS between blue/orange lines where BLUE goes under the ORANGE -> this will lead to an injection of BEARish momentum and further price DECLINES.
CONCLUSION:
CRWD has reached a critical SUPPORT zone, for us to start our descent back to the all time highs we need to maintain SUPPORT here. Some signs point to bullishness where others give off signs of continuation of a DECLINE from our REJECTION zone. But the first thing that needs to get done is confirming SUPPORT above the mentioned zones. Important to see what price action and the indicators do come end of the week.
Stay tuned for more updates on CRWD in the near future.
Thank you for taking the time to read my analysis. Hope it helped keep you informed. Please do support my ideas by boosting, following me and commenting. Thanks again.
If you have any questions, do reach out. Thank you again.
DISCLAIMER: This is not financial advice, i am not a financial advisor. The thoughts expressed in the posts are my opinion and for educational purposes. When trading always spend majority of your time on risk management strategy.


Bullish Signals for CRWDCRWD formed an inverted head and shoulder pattern in August 2023.
Price broke the neckline on high volume. Thereafter, a bullish flag pattern has resulted.
On 8 September 2023, CRWD broke above the high of 1 August.
CRWD has broken out of the rectangular formation in which it had been trading since May 2023.
Squeeze Momentum indicator has just fired (black dots have turn grey).
Overall, seems like beginning of a bullish trend lasting several weeks.

CRWD is on the verge of a Stage 1 breakoutCrowdStrike is in the cusp of breaking out of a Stage 1 base. Its currently slightly above the AVWAP from the peak in Nov 2021 with a new Relative Strength high compared to the SPX. It reported stellar numbers in the last quarter earnings with EPS growth of 106%.


Buy 115-125; sell 135-250Seeing some long-term trends aligning
BUY POINT:
Low from each prior shoulder of head and shoulders ~116
Long-term trendline support: ~105 today, but closer to ~115 by EOY
SELL POINT:
Prior head and shoulders neckline 136
Prior resistance around 150
CAUTION:
If we break ~116, it may not be until ~90 that we find support (head of prior head and shoulders

CRWD rising channelOn the chart we can see the rising channel. We expect the price break down.
Our entry would be at the breakout point or when the price retest previous support and confirms it has resistance.
Target is shown on the chart.

CRWD to 190CrowdStrike seems to have found a base in early 2023 and is now tracking a potential support trend. A potential rebound is expected near 137.87, aiming for an initial target at 157.04. Further gains could lead to targets at 177 and 190. A drop below 137.87 might suggest a move down to 120.

CRWD: KEY LEVEL=146.9, TARGET=169-182.1, RISK=140CrowdStrike is a buy on the dip if stock's price falls below 150 mark. As long as stock's price holds above 140 level, its target would be a range between 169 and 182.1
KEY LEVEL=146.9
TARGET = 169-182.1
RISK=140

CRWD ,, Buy opportuinity Uptrend
Based on my strategy, this chart is inside an uptrend and investing on it has low risk. This is a breakout from a level price and my suggestion is buying and as usual dont forget setting a good SL for your trading.

Long CRWDMacro : Snp and QQQ in uptrend
news/hype: ai
ta: price in strong uptrend, flag break upwards
entered ,
stop below the 145 region with strong firm close
CRWD - opportunity to buy this dipCRWD broke up both above its neckline @ 139 as well as it's 200 day moving averge on 18 May. Traded to a hgh of 162.25 before retracing all the way to retest it's neckine. It formed a mini pin bar right at the neckline, affirming that the neckline is now the "support" in the near term.
This is a 2nd opportunity to long if we had missed the breakup, with an initial stop loss just slightly below the neckine of $139.
Expect some resistences should it able to rise towards old supply zones around 167,181,195 and 205 etc).
Take partial profits and also trail stops up along the way according to one's risk appetite and trading style (short or longer term).
Disclaimer: Just my 2 cents and not a trade advice. Kindly do your own due diligence and trade according to your own risk tolerance and don't forget that money management is (probably the most) important! Take care and Good Luck!

KIV Short : CRWD (30/6/23)KIV Short
0- Extreme greed. Market up but peaking.
1- Support ema20
2- Breakout downtrend line
3- Wait momentum candle <<
4- Wait volume candle
Risk $100/27 lots
Entry-143.0
SL-147.4
TP1- 134.2

PlebstrikeAnother chart that looks to have bottomed and is in the early stages of an uptrend - scam it.

Pullback Buy in CRWDThis cybersecurity stock has been a top performer in 2023.
After a vicious Stage 4 downtrend that wiped out 70% of its value in the 2022 bear market, CRWD has come ripping off the low this year.
It reclaimed its 200-day moving average last month and continues to advance higher.
The dashed line on the chart above shows a key support/resistance level in CRWD. The stock found resistance here earlier in the year and it has so far served as support after getting above the 200-day.
The stock is also sitting on its 50-day moving average which should serve as additional support.
I would consider buying here with a stop just below the 200-day line at $133. This would represent a 7% risk on the trade.

CRWD to continue higherInteresting EW setup here fro CrowdStrike. Looking for continuation higher into wave 3 as we have just reached equality of wave (c) vs. (a).
If I am correct we shall see an acceleration to the upside soon.

CRWD: Possible rebound around 137.3/138.3Crowdstrike stock's price is likely to rebound if it reaches the support zone between 137.3 and 138.3.
Initial target is seen around 151.

CRWD to 200Price is close to a strong S&R level.
Charts looks pretty good for bullish position.
Entrance: Anytime at 156 or above
Take profit= 199
STOP LOSS=145.16 (Fibo lvl S61)

CRWD looks good to go longCRWD has closed above 20 DMA after correction. Going long here with SL closing below 20 DMA

Defense with a lot of weapons Crowdstrike is the fastest growing cybersecurity company. Has the deepest pockets and with the latest cyber attack on the government will be the most widely known in America and most sought after. The base is in and ready to take the next leg higher. Watch for news as a catalyst 6-17-2023

CRWD - Rising Trend Channel [MID TERM]🔹CRWD is in a rising trend channel in the medium long term.
🔹Next resistance 160.
🔹Weakening rising trend signals potential break early.
🔹Overall assessed as technically neutral for the medium long term.
Chart Pattern;
🔹DT - Double Top | BEARISH | 🔴
🔹DB - Double Bottom | BULLISH | 🟢
🔹HNS - Head & Shoulder | BEARISH | 🔴
🔹REC - Rectangle | 🔵
🔹iHNS - inverse head & Shoulder | BULLISH | 🟢
Verify it first and believe later.
WavePoint ❤️
