Ehhh i wouldn't invest just yet...Over the past 5 years CSCO has been very bullish but right now, probably because of the Tariffs thing with Trump, the stock is forming a Double Top and is probably going to go down until July or around August when the earnings report gets released. Its basically doing what FTNT is doing right now. Go in at around $47.00.
1CSCO trade ideas


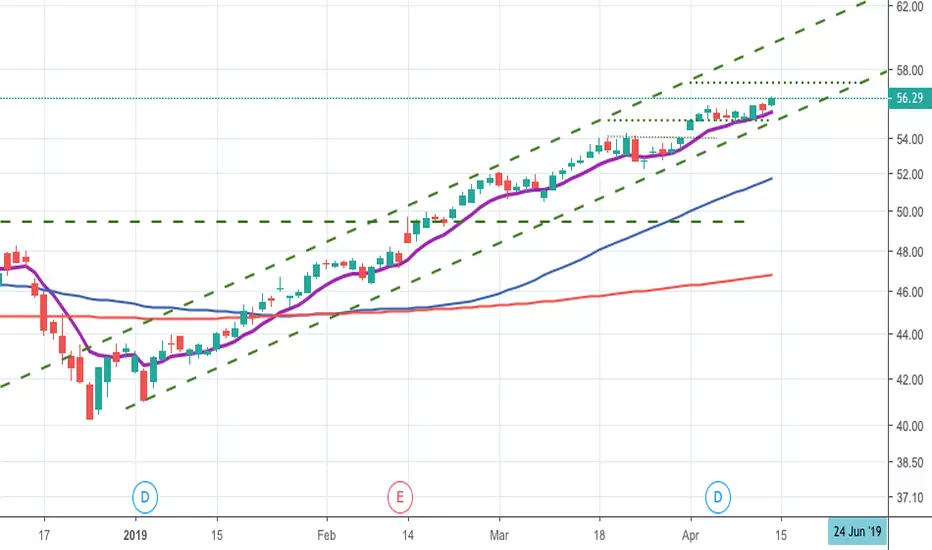
$CSCO Chart is negative into earnings $49 Key Level The breakout in CSCO has stalled significantly as the market sell off has struck just at the wrong time. As earnings approach indicators have turned very negative very quickly, investors have fled stocks with China exposure.
We will not be taking any position into earnings but may look for a bounce post earnings as is the norm.


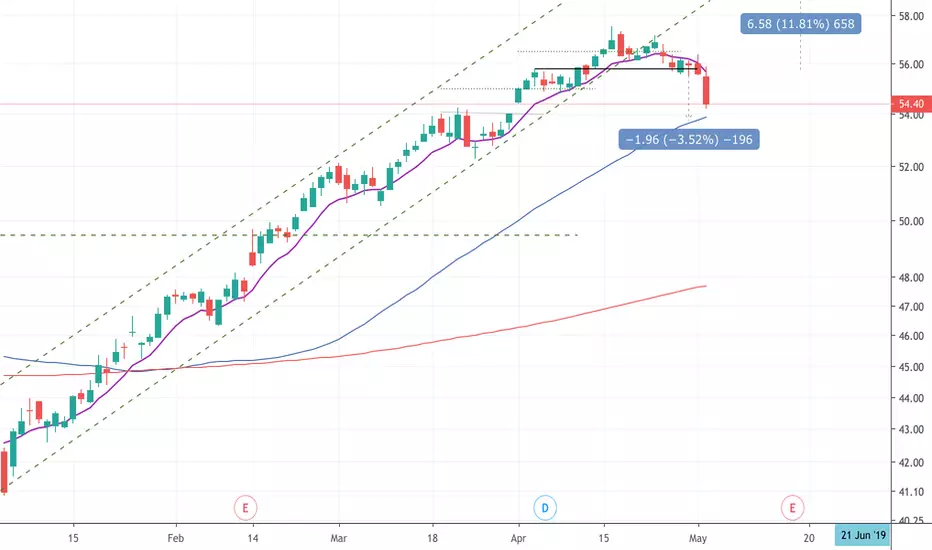

CSCO Way Over-extendedBear Case:
*Bearish RSI Divergence
*Broken Wedge up
*Tech/QQQ showing major exhaustion
*ER
Bull Case:
*Tech still holding
*China
*ER
***Too Many bearish warnings on the technical side. Holding JUNE 21 PUTs with min target at 50$... Let's talk about it***

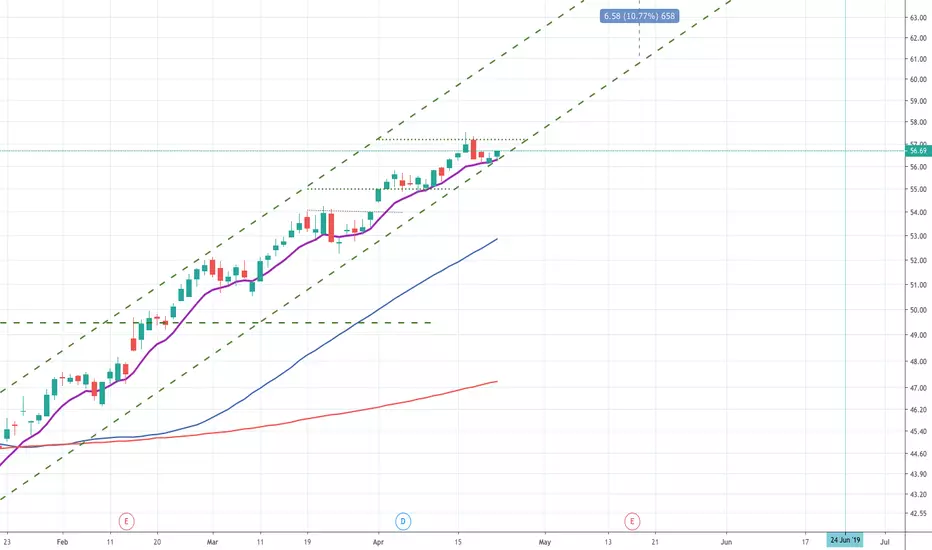
Cisco Systems (CSCO) Sell $56.33 > $48.63 (Profit:Risk = 4.48:1)NASDAQ:CSCO
Cisco Systems, Inc.
Information:
We go up the channel for too long.
Now there will be a breakdown and a reversal of share price.
About stop loss:
Stop loss is placed just above the weekly candle in case of a false touch.
Weekly chart:
Daily Chart:
H4 Chart:
------
Sell = $56.33
Take Profit = $48.63
Stop Loss = $58.05
------
Profit:Risk = 4.48 : 1
Profit:Risk = +13.67% : -3.05%


CSCO: Sort opportunityAn intraday high potential, Back Tested Sort Analysis.
We ll try to enter into the correction of the uptrend movement.
DETAILS ON THE CHART
NOTE: Entry range area above the entry point, is calculated upon 80% of the recorded pullback back tested past performances
DISCLAIMER: This is a technical analysis study, not an advice or recommendation to invest money on.