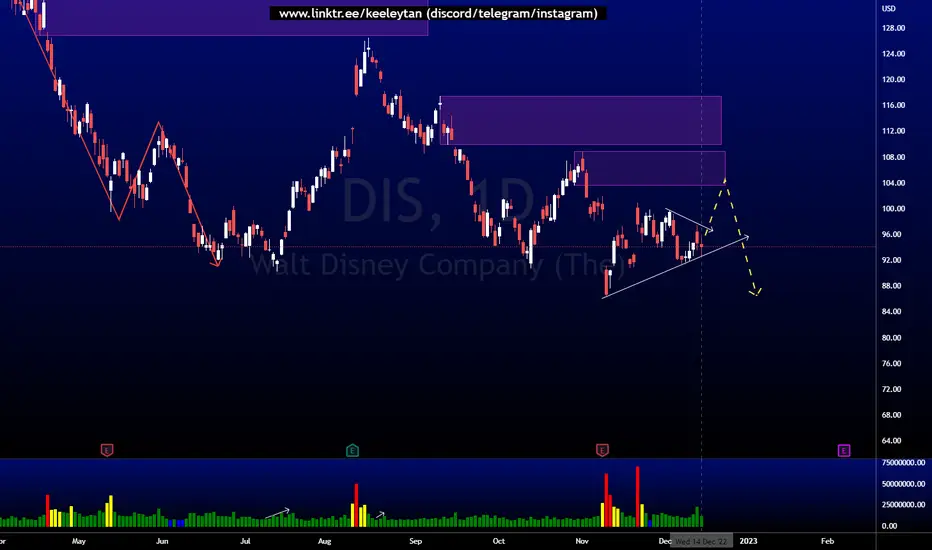
shorting DIS oversold on stoch + RSI
bearish hidden divergence.
touching downward trend line.
PD: shorted at 94.3 let's see.
1DIS trade ideas

Disney DowntrendDisney in a downtrend.
Take note of all comments and disclaimer on the chart
Constructive comments only. EES

$DIS Just not ready!?!If we watch this ticker where it is, it is practically in no man's land. We know it is in a down trend but the question is this, will this be the bottom for a reversal.
We are wedging here but if you are not careful you would think that this is the time to jump in the stock.
DON'T!!!
Get a break out above or a rejection before you commit.
So lets put it into perspective.
Bullish case: This is the level needed. Yes it is far from the break of the trend line, but if we hold above here it will help fins support for the reversal. Above 95 we can race to test 100. The divergence could help push it.
Bearish case: This down trend from august 2022. Don't fight the trend.... 85 level will be tested if this reject and fail to make a higher high. Lets see if the pivot plays out and forces the stock to head back down to the bear line.

DIS reversal
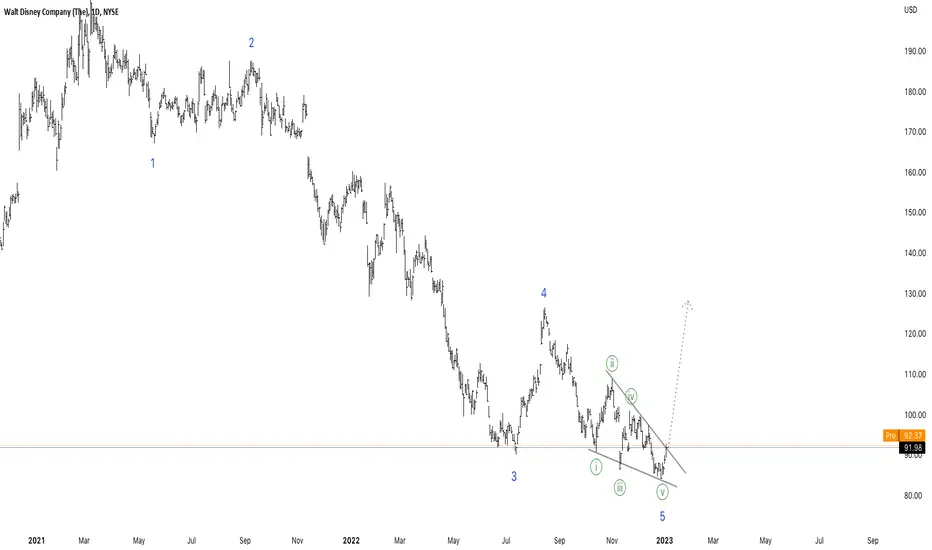
NYSE:DIS wave analysis
Starting 8th of March 2021 we have a big impulse wave down (1to 5) finished or almost finished.
The interesting part is that Wave 5 has taken the shape of an ending diagonal.
An ending diagonal in the words of R.N Elliott is singling "The price has come too far. Expect dramatic reversal ahead."
So we need confirmation that the price breaks the minutes 2-4 trendline and the bigger impulse wave is done and dusted.
I'm doing all my work on Tradingview, so if you find this useful give me a like.
Thanks for your support! For more chart analysis like this please get in touch.
Disclaimer: This is my analysis and does not constitute financial advice!
Historical buy opportunity in DisneyThe algorithm is showing Disney in a very important historical support zone.
In the chart you can see the historical channel and how the price is approaching the support line. Furthermore the 80$ is a key support that if it's lost could move the price to 43$ easily because there is no other serious support or historical volume.
So, by buying slightly over 80$ or even 90$ you can use a very tight stop loss and unlock a potential of 60% to the first take profits or even 120% if the prices goes back to maximum price.
Right now and leaving in the first take profits, you can risk 1$ to earn at least 6$ which is a crazy risk reward ratio for any trader.

DIS has such a positive outlookDIS has seen a much higher 52 week high, I do not think it is time for DIS to reach those highs not yet, but there are some signs pointing to the price reaching $120, support and resistance has formed, with resistance being sort of weak, not to mention, earnings are coming soon, could that mean DIS will bounce even further following it?

Disney: Invest in your kidsI entered the market and took some $DIS, first target is $94, the second one is $99, clear short-term resistances.

DIS, 10d+/-29.56%falling cycle -29.56% more than 10 days.
==================================================================================================================================================================
This data is analyzed by robots. Analyze historical trends based on The Adam Theory of Markets (20 moving averages/60 moving averages/120 moving averages/240 moving averages) and estimate the trend in the next 10 days. The white line is the robot's expected price, and the upper and lower horizontal line stop loss and stop profit prices have no financial basis. The results are for reference only.

Disney DivingDisney in a downtrend.
Take note of all comments and disclaimer on the chart
Constructive comments only. EES

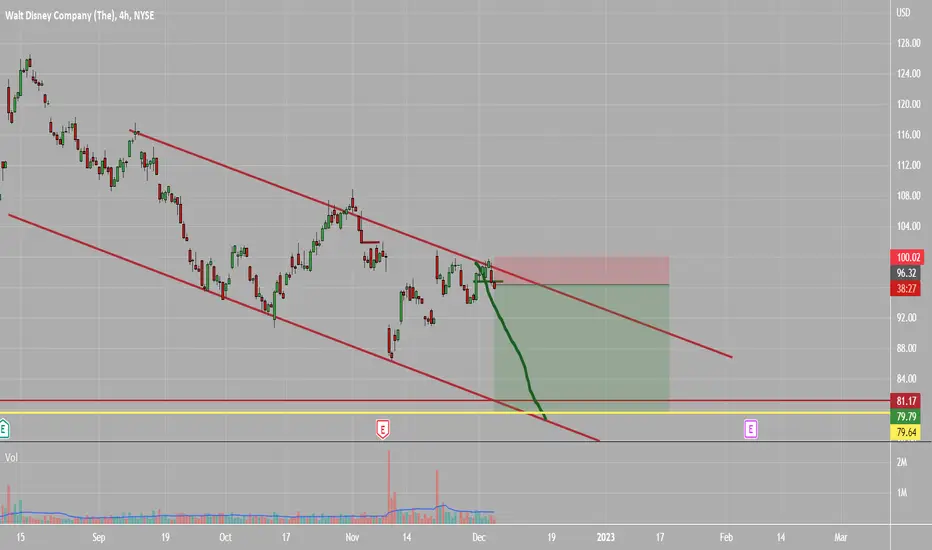
$DIS ShortWe have a good opportunity to short Disney from the top of the bearish AND aggressive channel!
keep your stop loss above the last 4h candle.
DISNEY #DIS Buy Entry#disney looks good at $75, 3 trend line crossing each other to show support along with 100EMA . should see a big bounce from $75

DIS major support W/ minor resistance.Here we are looking at DIS on the daily TF.
As you can see here we are looking at a trend line going back to 2013. The Yellow line acted as resistance until the end of 2013, then a break out occurred. The yellow line now serves as a great support and even re-tested the line at the Covid lows in 2020.
The support line (yellow line) I have outlined on the chart connects all the way back to the 2013 and should be support again in 2023.
If price continues hitting that support line (2-3 more times), we can expect a break below that line and then it will act as resistance once again.
In the immediate short term, You can see the down sloping Green trend line which is being tagged with the 3 purple rectangles. That line is acting as resistance and will only need a couple more hits before that line breaks and the price should break above it.
The yellow support line and the green resistance line is creating a wedge pattern and eventually it will break one way or another.
Being as the green line is minor and the yellow line is major I anticipate a bounce and a push through the green resistance line.
What do you think DIS will do next? Let me know in the comments!
Cheers!

Disney DIS - $84.75 NEW POSITION ! $100 TARGET0. Notes to follow;
1. Printing a descending wedge;
2. Going to resolve today or tomorrow;
3. $100 Target;

DIS Trade Idea
$DIS is looking good for a small bounce / PullBack so the Bears can Reload their shorts .
I'm in this one Long using CALLS for DEC 30 / STRIKE 90. (Theta is against me, so I need a fast and reliable move to the upside to make any money)
But again, another great R:R, but counter trend, and as s a beta weight of 0.70 with SPY, we need the Markets to bounce to help this trade.
#tradesafe

$DIS - Double bottom ounce?#Disney could see double bottom bounce. #DIS
Target 1 - $90
Target 2 - $93
Target 3 - $100
Target 4 - $108
Risk - a fall to $80
——
Trade is done when it hit one of the target or stop loss is hit.
Disclaimer: Trading note. Not an investment advice.

DISNEY 1 HOUR IDEA HELLO GUYS THIS MY IDEA 💡ABOUT DIS is nice to see strong volume area....
Where is lot of contract accumulated..
I thing that the sellers from this area will be defend this SHORT position..
and when the price come back to this area, strong sellers will be push down the market again..
DOWNTREND + SUPPORT from the past + Strong volume area is my mainly reason for this short trade..
IF you like my work please like and follow Thanks

$DIS on 1HR Analysis$DIS on 1HR Analysis
Expecting Disney to be up at open and after 9am to fall.
DIS
Support: $85.92
Resistance: $87.97
What are your thoughts?
Thanks,
Kelly

DIS AnalysisPrice did not play out as analyzed last week which was to take out the buy-side liquidity and mitigate the bearish POI at 108.84 before falling. Price took out the sell-side liquidity first. Price also took the liquidity at 86.28 and is now showing a change in character on the lower timeframe. I'm expecting price to make a retracement back up to the bearish POI at 97.39 next.

Disney Could be Bottoming TodayHitting trendline support from 1998, hitting a trendline that also marked the March 2020 bottom. Lines up with my outlook that equities, housing and crypto have bottomed if it holds.

DIS 9 DEC 22 91/ 16 DEC 22 96 Diagonal BEAR RALLY SET UP:
DIS made a new swing low 11/09 and since then it has made its way back to the 50day with lower or equal volume making this a potential bear rally. The entire market has been in a bear rally, so based on the patterns forming, this should make it's way lower to fill the gaps below.
I used the doji candle on the 28th as my reversal candle at the 50day. And today it trigger because it traded below the previous days candle. Momentum indicators suggests more downside.
I'm set up for max loss on this trade so if this decides to head higher, I'll be ok and move on to the next trade.
I determined 91 would be a safe middle zone target based on the downward channel I drew. And if the market decides to bring this lower....to lets say 84 or 83, that would touch the lower trend line and could bounce back up to 91 to hit the apex of the trade on the 9th.
DIAGONAL SPREAD STRATEGY:
If this falls below my 91 target before Dec 9th, I'll wanna see if this goes down and touches 83 or 84. Lets say it gets there by Monday the 5th. It may want to rebound back to 91. If it does that and gets to 91 by lets say the 8th, I'll close out the entire combo. If this just stays below 91 by the 9th, I'll close out the entire combo as well.
If this goes sideways until about the 8th or the 9th (that would be around the upper trend line which could happen) I'll still have the Dec 16 96 strike. I'll have to watch it the week of expiration to see if I'll wanna close this out a couple days before the 16th.
If this goes higher I'm set up for max loss, so I'll just move on to another trade.
Ideally I wanna see this at 91 or lower by the 8th because I prefer to close the entire combo and move on to another trade.

Disney DIS Short - Descending Triangle/Head and ShouldersDisney DIS Short - Descending Triangle/Head and Shoulders
Disney preparing to break down from a descending triangle . Expecting low $80s price range.
Longer term there's a clear Head and Shoulders pattern that would break down if the descending triangle also breaks

DISNEY - POTENTIAL SHORTDisney was down trending on the 4H timeframe from Nov. 1st to Nov. 9th 22. After a pullback to the .618 fib level, price from the stock began to consolidate and price condensed. Dec 6th price broke out of the consolidation and retested on Dec 13th.
The Price Action of Disney stock is currently creating a Bearish Pennant . If price can break $92 and reject successfully, a short could be profitable.

DIS AnalysisPrice has been consolidated for a few weeks since earnings release. There are a lot of sell side liquidity being built, and buy side liquidity building up recently. I'm expecting price to take out the buy side liquidity and mitigate the bearish POI at 108.84 first if price wants to go lower.