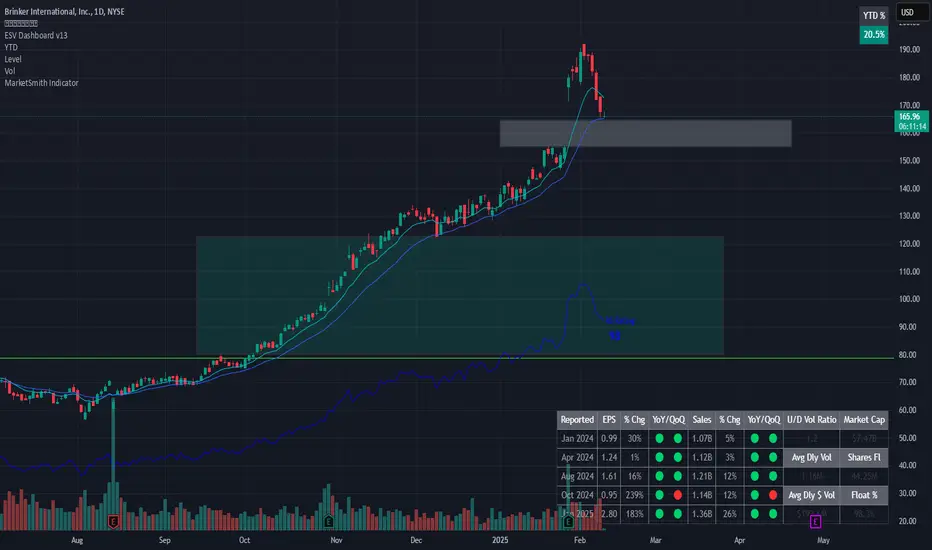
Chili's: Still Cheap, Still Ignored, Still A Strong BuyCasual dining has been in limbo post-pandemic—too pricey for impulse meals, not fancy enough to feel special. But Brinker International (EAT), parent of Chili’s and Maggiano’s, is proving there's still a winning formula if you get the execution right.
🛠️ Operational Overhaul at Chili’s
Chili’s has quietly transformed itself. A deep operational review led to smarter kitchen processes and a slimmed-down menu. These changes boosted both food quality and efficiency. By simplifying things like wing sauces and adding real-time kitchen tools, Chili’s improved service speed and cut costs—freeing up staff to focus on core offerings like burgers and margaritas.
As management put it: "Marketing brings guests in, operations bring them back."
📣 Marketing That Works
Chili’s is also nailing the branding. Viral TikToks and a more relaxed, value-focused message have resonated with consumers—both old fans and new. Unlike competitors chasing trends or discounts, Chili’s has leaned into what it does best: an affordable, comfortable dining experience.
The strategy is working. Traffic is up, and customers are coming back—not just for the hype, but for the value.
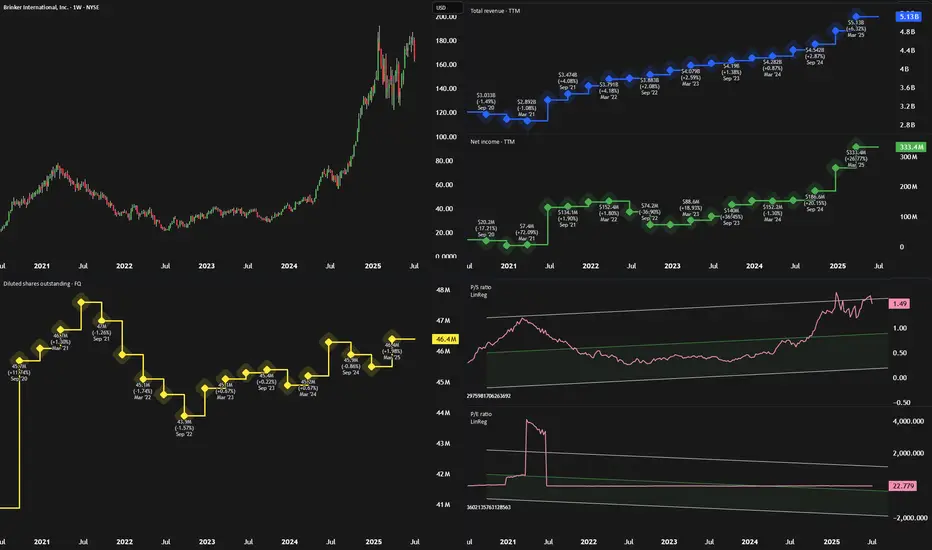
📊 Financials and Growth Potential
Analysts expect revenue growth of 21%, 5%, and 5.5% over the next three years, with EPS potentially growing more than 11% annually. However, we believe these estimates undervalue Chili’s long-term growth, especially as margins improve and brand momentum continues.
At just 11x cash flow and a PEG ratio of 0.47, EAT is significantly cheaper than peers like Darden (2.1) and Shake Shack (3.8). That discount suggests the market hasn’t fully priced in Brinker’s turnaround.
⚠️ Risks to Watch
Slowing improvements: Much of the "low-hanging fruit" in operations may already be picked, so future gains could taper off.
Debt load: With $430M in long-term debt, a business slowdown could raise financial pressure, despite recent earnings strength.
✅ Bottom Line: Strong Buy
Chili’s turnaround is more than a viral blip—it’s a smart reinvention. Combined with solid execution at Maggiano’s, Brinker International is proving that casual dining can still thrive.
With strong fundamentals, smart leadership, and a discounted valuation, EAT stock looks like a compelling 'Strong Buy' for the next 12 months.
1EAT trade ideas
EAT eyes on $134: Earnings Dump fell into a key support to buy?EAT earnings report was apparently pretty bad.
Fell through several supports but trying to hold.
Watch critical and proven zone at $134.06-134.77

Brinker International (EAT) Brinker International (EAT) staged a strong rebound after testing the 50% Fibonacci retracement level of the move from 56 to 192.21. In Friday’s session, the stock broke through the key resistance zone between 165.34 - 168.90. Sustaining levels above 168.90 would confirm the breakout and reinforce bullish momentum, opening the door for further upside toward 177, 183, and the previous peak at 192.21.
A breakout above 192.21, which marks a major resistance level, would signal a continuation of the broader uptrend, paving the way for potential targets at 204.90, 211.29, 221, and possibly 235.
The stop loss is below the last higher bottom at $ 162.30.
Technical indicators, particularly the MACD, are trending positively and support the bullish outlook, adding further confidence to the upward scenario.
Disclaimer: This analysis is for informational purposes only and does not constitute financial, investment, or commercial advice or recommendations.

Brinker International (EAT) Correction completed?After almost three months of correction and consolidation, the share price is fighting its way back up and trying to turn the corner out of the Bopden formation. Pre-market prices are already above the last interim high. A supposed cup is forming, inviting investors to follow the trend of the next upswing.

Buy Brinker InternationalShort Term Trading Advice by Naranj Capital
Buy Brinker International
● Buy Range- 151 - 156
● Target- 166 - 169
● StopLoss- 145
● Potential Return- 6-8%
● Duration- 14-15 Trading Days

EAT to $160My trading plan is very simple.
I buy or sell when price tags the top or bottom of parallel channels.
I confirm when price hits Fibonacci levels.
So...
Here's why I'm picking this symbol to do the thing.
Price at top of channels (period 100 52 & 26)
Stochastic Momentum Index (SMI) at overbought level
VBSM is spiked positive and over top of Bollinger Band
Entry at $185
Target is $160 or channel bottom

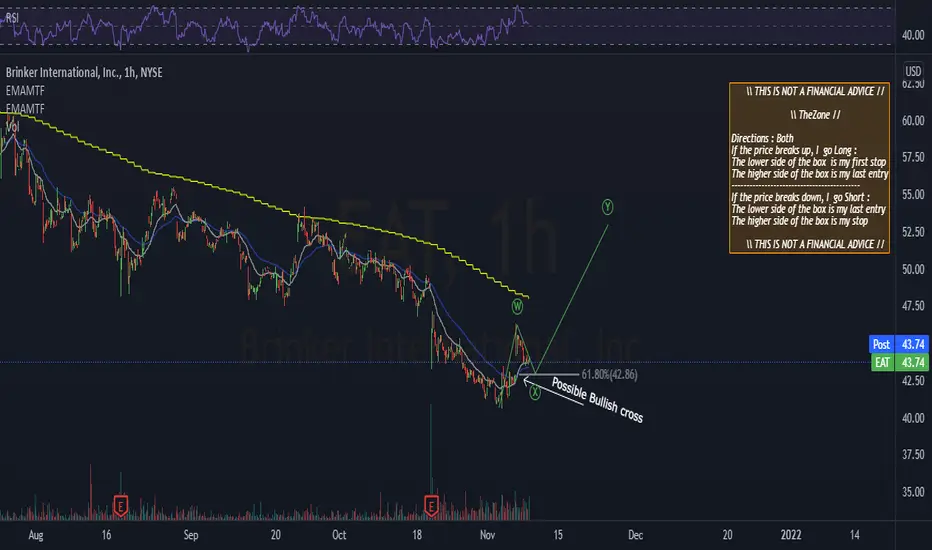
EAT - LONGJust going to try this " dip buy " here at 21 ema , as EAT is showing some potential reversal signs and I am bullish market as we had a news failure yesterday .... Just a share , starting up small here...
This is premature but I am going to give it a shot .... as this is certainly a top trender and meets all the trading requirements , it so far also has very much respected the 21 ema , was only under once on Dec 9th since GLB and immediately took it back next day . I'm sure a lot of institutions are seeing that too....
This is a late buy vs GLB breakout and stock still super extended on weekly and monthly .Doesn't mean we cant make money still though .
1) above GLB
2)1/2 gaps pre glb
3) exceptional earnings and sales
4) tight clean moves
5)Good RS
6)Has 20% weekly candle
7) Bonus here is 2/2 gaps after GLB too ....
8)Also bonus ,yesterdays close also a potential volume anomaly = BUYING
If we close below 21 ema twice or show specific weakness I will exit and update the trade in comments section .
BRINKER INTERNATIONAL NDReasonable analysis? what do you think? let's discuss.
My wish for an antry would be at the marked area with good volume...
peace!

EAT - wrong direction! :)See the dragon now?...lol. I drew that for fun...I hope you get a kick out of it. Still a bad dragon. I lost on this one while playing the small caps earnings pop play I've been doing the last few weeks. I am 8 for 12 now in the black on small cap pre-earnings buys. I'll take that percentage all year.
My AIT buy is in from today and I'll see how it progresses tomorrow.
It's a weird time in the market right now so I'll stick to very short holdings. 5-10% pops in a day are fun right now with the smalls but it may be time to just sit on my hands till Sept. Seasonality dip for the next month or so will keep me tuned in...

EAT - another small cap earnings playI did remember to get this one before earnings tomorrow morning. EPS estimate is as high as I am...but I'll start selling tomorrow morning if/once we hit 6%

EAT Brinker International Options Ahead of EarningsAnalyzing the options chain and the chart patterns of NU Holdings prior to the earnings report this week,
I would consider purchasing the 40usd strike price Puts with
an expiration date of 2023-10-20,
for a premium of approximately $3.90.
If these options prove to be profitable prior to the earnings release, I would sell at least half of them.
Looking forward to read your opinion about it.


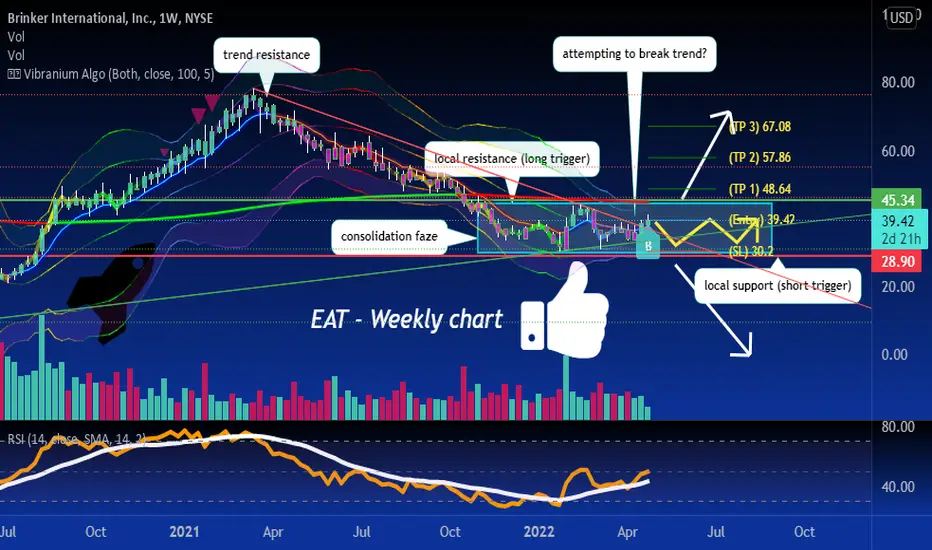
big breakout coming after this chop! :)EAT has been in consolidation mode for about half a year now *heavy yawn*, lets wait for a clear breakout form consolidation because there's no telling how long it could last !
long trigger at 45.34, short trigger 28.90

Bear FlagLooks good for a 10% drop from here. RSI and price breaking down lower on higher volume. Extended downtrend in a already bad market.

QuickTradeStop at 42.8
Worth a try even so the bullish cross is not so strong.
RSI can't move below the 50.
4 Hr. "INVERSE HEAD & SHOULDERS" BULLISHClassic Inverse Head & Shoulders bullish idea.
Enter long at green, exit for loss at red or exit for gain orange lines.
DISCLAIMER:
I'M NOT A PROFESSIONAL TRADER AND THIS IS NOT A TRADING ADVICE.

EAT to break trend line EAT is forming a nice triangle/ head and shoulders short of pattern. If it can hold its strong resistance point then close above the trend line, watch out for a bullish run


$EAT Bullish Unusual Options Activity$EAT Brinker International, Inc. - Possible downtrend breakout closing above the 9d today.
Bullish Unusual Options Activity
$1M bet placed on $75 July OTM calls today (7x OI)
Near term target: $76-$78 range by early May
Note: This is NOT investment advice. Educational only.

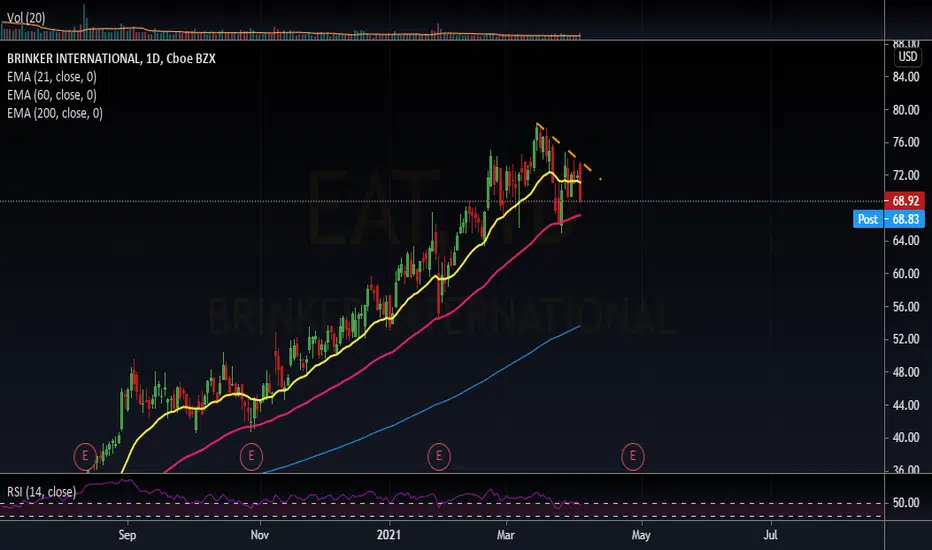
$EAT Start of Wave 5I am new to analyzing charts using the Elliot Wave theory and came across this stock on a few other publications.
Upon further review of the YTD time frame, I believe we are entering Wave 5.
There was a large drop due to the pandemic, which has resulted in what seems to be the start of an Elliot Wave. At the beginning of September we hit the top of wave 3 and met resistance at $48. Since then, there has been a 5 wave counter trend meeting resistance at the $47-$48 range. As of October 15th, we've broken through the $48 resistance and it seems to be trending up.
I am unsure of the micro waves I've plotted as there doesn't seem to be quite the pullback for wave 4 during the macro wave 3 trend.
Curious to thoughts and suggestions.

$EAT Start of Wave 5 pending Earnings CallI am new to analyzing charts using the Elliot Wave theory and came across this stock on a few other publications.
Upon further review on the 2h time frame, I believe we are entering Wave 5. There was a large drop due to the pandemic, which has resulted in what seems to be the start of an Elliot Wave. This is indicated by the 20 and 50 EMA’s crossing the 100 EMA. We see a pullback once the EMA’s cross again at ‘2’.
At the beginning of September we hit the top of wave 3 and met resistance at $48. Since then, there has been a 5 wave counter trend meeting resistance at the $47-$48 range. As of October 15th, we've broken through the $48 resistance and it seems to be trending up, pending the earnings call that occurs on October 28, 2020.
Curious to thoughts and suggestions.
