Copper futures at 9 year highs, FCX SCCO HBMCopper futures at 9 year highs and all time high is around $4.65, FCX is the world's largest publicly traded copper producer. It is following the price of commodity. Demand for copper from renewable sector is growing as new power generation capacity addition renewable energy (China/India).
Options - The March 19 $38 calls traded over 11000 times, over 34,000 in Open interest. The march put call ratio is .46.
April options put call ratio - .76, probably a pull back at some point after strong move friday.
1FCX trade ideas


FCXFreeport-McMoRan (NYSE:FCX) Resistance remains at $32.5 and I would be a buyer on a break above that level for a trade.


FCX: Trade Idea FCX: Trade Idea: Divided reinstatement, restructuring of board, upside on commodities and natural resources entering 2021, electrical vehicles driving up demand for Cu.

FCX - Trend Retracement Reversal (Etoro Portfolio)
Since price cross MA30 @June 2020 in weekly, it is in a strong uptrend. Price is reversed nearby MA50 (blue line) appeared a price rejection (pin bar).
Next day one white soldier candle as confirmation day, stochastic oscillator indicator shown price at oversold range moving average line is toward up direction.
I have a position, and look for 2R profit.
=====================================================================================================================
I will be popular investor in Etoro, take a look of my portfolio and copy me to start the trading journey.
My Etoro Profile:
www.etoro.com
Etoro Registeration Link:
etoro.tw

Copper Mining Stocks - BTFDMulti-year copper bull-market, says Goldman Sachs Commodities division: www.reuters.com
This is the pullback institutions have been waiting for. Increase exposure in copper stocks such as Freeport, Lundin Mining, First Quantum, etc.


Bull Run Over FCX, XI have closed my positions over the last couple of weeks for 100%+ returns on both these names. I have been in FCX since $5 and X since $9. If you go back far enough in my ideas you can see that I posted about this way back when. If you look at these for the last 10 years they are in a major downtrend. I think they are both putting in reversal patterns and will not see these high levels for yearsssss to come.
These ran up because people think inflation is occurring so, they piled into this. But, I don't see the demand. I am no longer long, it had a good run but, this is a short in my books.

FCX LongMost of the miners took a hammering today. As predicted last week, the DXY (dollar) is finding support and pulling back a little. The long term trend is however down and this weak recovery is inconsequential in the long term, but, responsible for the excess volility we see, and speculation by traders. This is what we witnessed at Mkt Opn. Lots of quick bucks made and lost in the first half hour today on those swings.


FCX seems to be breaking out with improving fund for commoditiesGood entry point on FCX with good R/R. Not investment advice. Do your own research.

FCX: Long at close of 25.5, SL close below 24, PT 30, 39, 44Consolidating like crazy after big volume bars earlier from few weeks. Needs lot of patience as it moves slowly. Ideally far out options or really long term hold (6 montsh) will work perfectly.

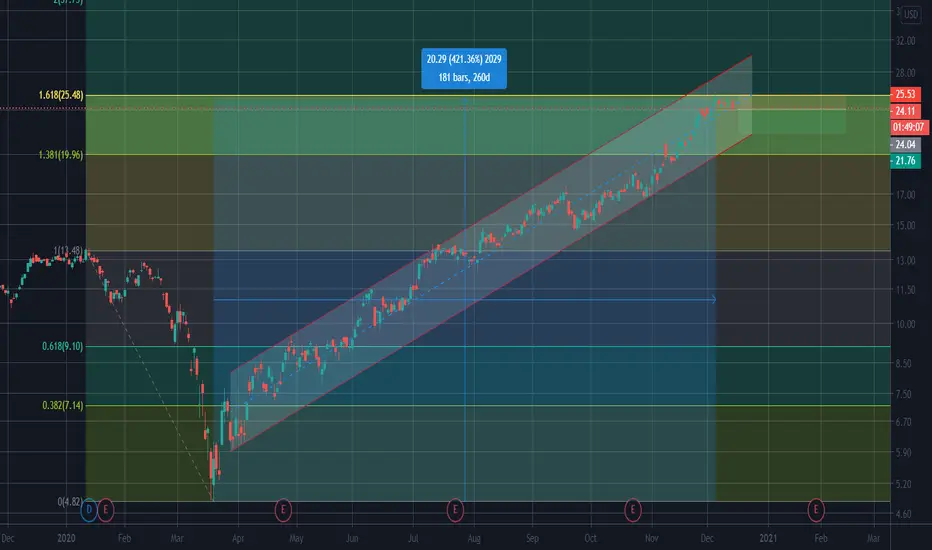
FCX is a buy or sell in the next 2 weeks?I just don't want to explain anything, because those who know technicals and Fibonacci will instantly take the proper action!
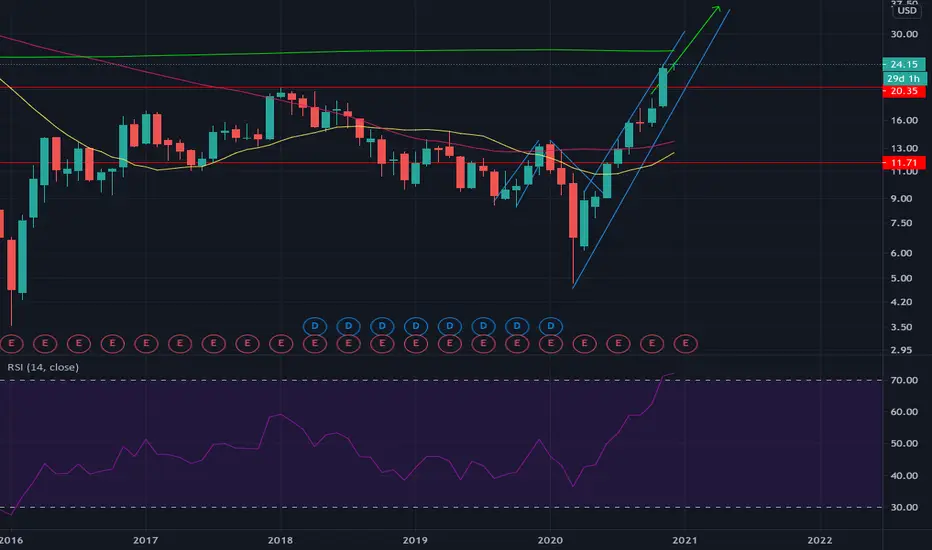
FCX still has room to run!Still is very comfortably in a bullish uptrend. Has room to run into the 30s before seeing some type of pullback. I would set my stop loss at $22. Happy Trading!

Freeport w49 2020. Buy 22 TP 35.Monthly
Uptrend continue
Weekly
Uptrend
Daily
Open Long on correction
Open 22
SL 18,5
TP 35
RR 4

Freeport w43 2020. Buy on positive earnings Q3 up to 20$Flat correction in Downtrend
Weekly
Reversal and Uptrend
Daily
Strong Uptrend
Price in 5th Elliot wave.
Looking for pullback and open position.
Positive earnings on Q3 will help to continue uptrend with steam
It is little bit risky active due to has Debt/Equite=1.1
However Freeport has other attractive financial stats, looking comptetive in sector "Cooper".
Variant conservative
Open 18
TP 20
SL 17
Positive with breakout
Open 18$
SL 14$
TP 35$

could hit 30not much has changed since the last request, has potential to do 30 before pullback, but sell on a break of the smaller trendline. goodluck :)


a couple outcomeslong over 20 short under 15-16 here imo. nice channel but these break eventually! goodluck. leave a like you found this helpful! thanks <3

Freeport w43 2020. Buy on positive earnings Q3 up to 20$Montly
Flat correction in Downtrend
Weekly
Reversal and Uptrend
Daily
Strong Uptrend
Price in 5th Elliot wave.
Looking for pullback and open position.
Positive earnings on Q3 will help to continue uptrend with steam
It is little bit risky active due to has Debt/Equite=1.1
However Freeport has other attractive financial stats, looking comptetive in sector "Cooper".
Open 18
TP 20
SL 17

FCX Back over trend line established since March lowNYSE:FCX Broke the trend line and bounced of SMA 50 nicely and now back over trend line.
Looking at $18.30 as the first PT and then $19.70.
SL at trend line.
None of the content published constitutes a recommendation that any particular security, portfolio of securities, transaction or investment strategy is suitable for any specific person. Information provided in this correspondence is intended solely for informational purposes and is in no way guaranteed.For financial advise seek appropriate investment advice from a licensed Industry representative.
