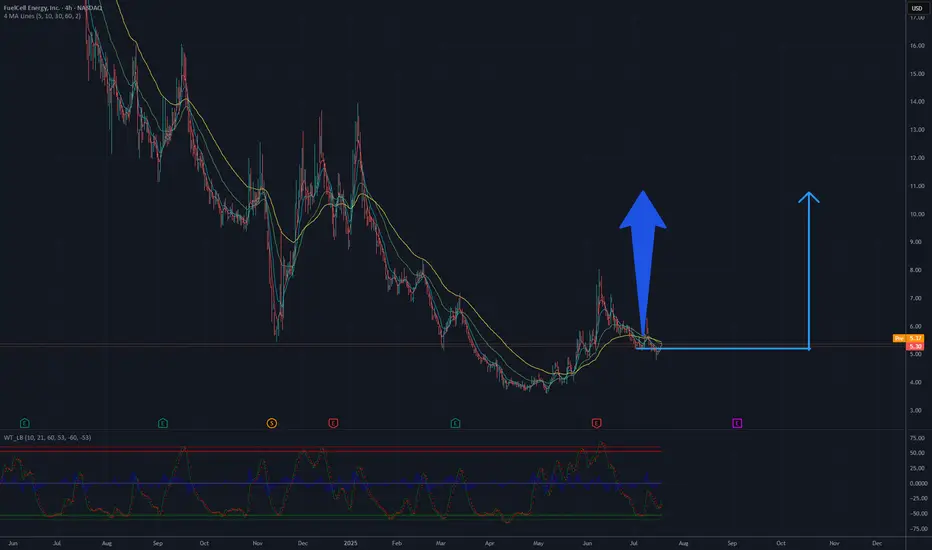
FCEL still relevant! 100% profit ! Potential TP: 11 USDTwo moving averages are visible (likely a short-term and a long-term one). The short-term one (yellow) crossed the long-term one (green) from below around May/June, which is typically a buy signal (golden cross). Currently, both moving averages show an upward trend, and the price is above them, confirming a positive sentiment. As of today, July 21, 2025, the current price remains relevant to this analysis.
Indicators at the Bottom of the Chart (likely oscillators): These indicators (though difficult to definitively identify without a legend, they resemble a momentum oscillator, perhaps MACD or similar) show buy signals and a clear upward trend after a period of overselling. The signal lines (green and red) also indicate growth.
Rises and Corrections: After a strong decline, the current rise appears to be a correction, but the momentum suggests potential for further upward movement.
Potential Resistance Levels: Around 7-8 USD, earlier levels are visible that could act as resistance.
Potential TP 11 USD
1FEY2 trade ideas
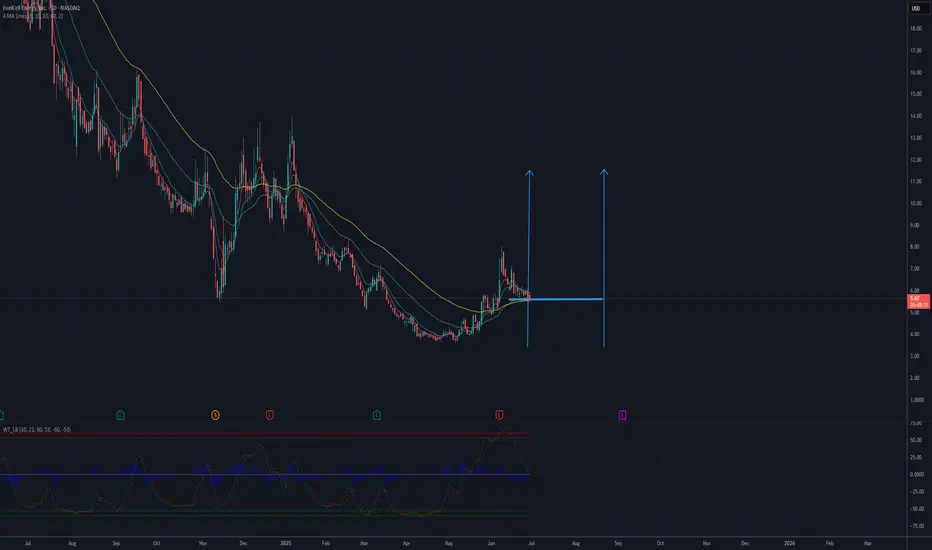
FCEL will back? 11 USD till September? Two moving averages are visible (likely a short-term and a long-term one). The short-term one (yellow) crossed the long-term one (green) from below around May/June, which is typically a buy signal (golden cross). Currently, both moving averages show an upward trend, and the price is above them, confirming a positive sentiment.
ndicators at the Bottom of the Chart (likely oscillators): These indicators (though difficult to definitively identify without a legend, they resemble a momentum oscillator, perhaps MACD or similar) show buy signals and a clear upward trend after a period of overselling. The signal lines (green and red) also indicate growth.
Rises and Corrections: After a strong decline, the current rise appears to be a correction, but the momentum suggests potential for further upward movement.
Potential Resistance Levels: Around 7-8 USD, earlier levels are visible that could act as resistance.
Potential TP 11 USD
KOREAN AIDaily weekly both look great, need to break this trend and get 7$ maybe a break out and retest of trend line to cool off the 4hr rsi or a plan ol rejection but the way small names are getting sent right makes me believe this is a decent possibility. Holding shares and a few 5 and 10 calls.

FCEL (LOG)Now that I have seen Log is more beneficial at assessing the long term routes of charts, I have applied it to FCEL
BOOM
Not financial advice

FCEL FuelCell Energy Options Ahead of EarningsAnalyzing the options chain and the chart patterns of FCEL FuelCell Energy prior to the earnings report this week,
I would consider purchasing the 5usd strike price Calls with
an expiration date of 2025-7-3,
for a premium of approximately $1.10.
If these options prove to be profitable prior to the earnings release, I would sell at least half of them.

Trade Setup Summary – Long Bias!🟢
Ticker: FCEL
Timeframe: 30-min chart
Current Price: $5.48
% Change: +39.09%
🔍 Technical Highlights
Price is breaking out of a wedge-like pattern, signaling bullish strength.
Breakout confirmation is marked at the yellow circle.
Volume is strong, indicating trader interest and momentum.
🎯 Trade Plan
Entry Zone: $5.48 (current breakout area)
Stop-Loss (SL): $5.08 (below wedge support zone)
Target 1 (TP1): $6.04 (red resistance line)
Target 2 (TP2): $6.70 (major resistance – green zone)
✅ Trade Bias
Bullish above $5.08
Neutral zone: $5.08 to $4.85
Bearish below $4.85

The cleanest if clean double bottoms incomingDouble bottoms everywhere but I especially like this on the monthly where the previous candle closed above the red support and the green current candle looks like it will close above it as well.
AMAZING! Just a shame at the pain many endured from this stock... ruthless world
Not financial advice


FCEL - 6 years later *spongebob*POTENTIAL DOUBLE BOTTOM
New low so potential bullish divergence
Not financial advice
Very long term hold imho

FCEL UpdateRemember this garbage? LOL, it reverse split at least a couple of times, so peak COVID price is much higher.
With Trump in office, probably gonna go bankrupt.

FCEL bullish divergence at double bottomI wonder what the earnings will show 👀
Make or break point for FCEL. I own some.
Not financial advice.

FCEL at the lowsImho fuel cell is a good gamble right now for a small investment
The new nasdaq rules suggest it is in their interest to keep the SP going up. This alongside the partnerships and products they sell - looks very good for the future.
Long term hold. Has potential to base here for a year or two ...
Not financial advice

Reversal needed on Day and breakout needed on HourlyOn the daily chart FCEL price is resting on the bottom of a bullish FVG and on top of a supply zone in the bottom of an upward parallel channel, there is a chance there might be a price reversal due to price position in the parallel channel and in the FVG, but the trader must be cautious of consolidation and fake outs and bearish break outs.
Turning our attention to the hourly, we see price in a descending triangle making lower lows and lower highs if we get a bullish break out or a break out that leads to a change of character/and BOS to an uptrend that may encourage the trader to go long however on the hourly if we get a breakout to the downside with a continuation of lower lows and lower highs that may encourage the trader to go short, as usual the trader must be wary of fake outs and consolidations on both timeframes. Please be so kind to review both charts for key levels.

FCEL BULLISHPlease take a look to FCEL, it have been a good performance during the last months, and its trending not seems to be stopped, the next first stop could be at $18 USD

Splits and pumpsHi guys, Tom Demark isn’t flashing any green yet, but we do have a reversal candle at the bottom of the bull fib channel. If the next candle can close above, then we can get a monthly entry point on a green 2 over a green 1. Look what happened after the last split.

FCELOn shorter timeframe FCEL has re-entered the bull fib, and broken through a short-term overhead. It’s a bit of headroom until the next resistance, so let’s see.

FCEL caught between a rock and a hard placeHi y’all,
It’s very ugly for FCEL bagholders like myself, and no attempt should be made to excuse this atrocity, but…volume is a good indicator, and volume has picked up last few days. Also, the price has seen aggressive price discovery as it bangs into some “kissing fibs”. Let’s hope this kissing escalate into a technical breakout on volume that the short interests cannot stop.

FuelCell Energy - Long-Target 58$Hello!
Head and Shoulders Reversal Pattern - target $ 58
I wish you good luck in making your own decisions, see you!

FuelCell Energy: A Strategy for Bullish MomentumHello, traders and investors. Before I dive into the analysis, please note that I am not a financial advisor, and this is not financial advice.
FuelCell Energy is showing several bullish indicators across different time frames, suggesting a potential for a significant upward move. Here's a refined analysis:
On the 4-hour (4H) chart, there's a noticeable shift in momentum to the upside, indicating a change of character. After a decline to a key support level (referred to as "order block"), the price action formed a double bottom pattern, suggesting a reversal. Additionally, a Bat pattern is emerging, with the ABCD structure signaling potential profit-taking levels at $2.16 (Fibonacci 1.272 extension) and $2.45 (Fibonacci 1.618 extension). The MACD indicator shows a bullish crossover and divergence, complemented by a double bottom in price and a higher low in the RSI, reinforcing the bullish outlook.
On the daily (1D) chart, two significant patterns are observed: a descending triangle and a symmetrical triangle. A decisive break and close above the $1.5 resistance level would confirm a breakout from these patterns, along with a downtrend parallel channel, signaling a strong move to the upside.
I initiated a long position at $1.10, setting a stop loss at $1.05 to mitigate risks from a potential bearish breakout from the descending triangle. My strategy includes taking 50% profits at $1.7, anticipating a possible retest of the breakout level ("crime of the scene") before aiming for a second profit target at $2.4 (Fibonacci 1.618 extension). It's crucial to be cautious around the $2.5-$2.7 levels, as the price may face rejection, underscoring the importance of not being overly greedy in profit-taking strategies.
This analysis is based on current chart patterns and indicators, which suggest a bullish run for FuelCell Energy. However, keep in mind that trading involves risks, and it's important to conduct your own research and consider your risk tolerance when entering positions.


Earnings / a look at the chartWill my bullish Fibonacci channel be redeemed on an earnings beat, or does Fcel go quietly behind the shed? I own a lot of shares, and I’m deep in the red. Let’s go!
